Introduction
Introduction
This program calculates the concentration of hydronium and hydroxide ions, pH/pOH and the fraction of dissociation (α) for a mixture of monoprotic acid and base. Input parameters include molar concentrations, volumes and acid/base dissociation constants. Calculation results of varying input parameters are tabulated and can be visualized in a scatter plot.
The concentration of hydronium ions is calculated using either of the following exact quartic and cubic equations:(1) (1+a[])[]−(b+[])−=(b+[]){[]+(1+a[])−(2) +−(+)[]−=0The quartic equation (1) is used by default, while the cubic equation (2) is used when a conjugate acid or a conjugate base in present in the solution.Unlike other approximation methods, these exact equations take into account the effects of self-ionization of water, changes in acid concentration and temperature. This leads to more accurate results particularly for solutions of low concentration.
V
b
+
H
2
C
b
+
H
K
w
+
H
K
w
2
[]
+
H
V
a
K
w
+
H
C
a
+
H
+
H
K
w
2
[]
+
H
3
[]
+
H
2
+[]
K
a
C
conjugatebase
+
H
K
a
C
a
K
w
+
H
K
a
K
w
Wolfram Demonstration: Sopanant Datta, pH of Monoprotic Acid and Base Solutions, Wolfram Demonstrations Project. http://demonstrations.wolfram.com/PHOfMonoproticAcidAndBaseSolutions/
Program
Program
Please “enable dynamics” if necessary.
Global variables are used for this program, please do not duplicate the output field.
Global variables are used for this program, please do not duplicate the output field.
Usage
Usage
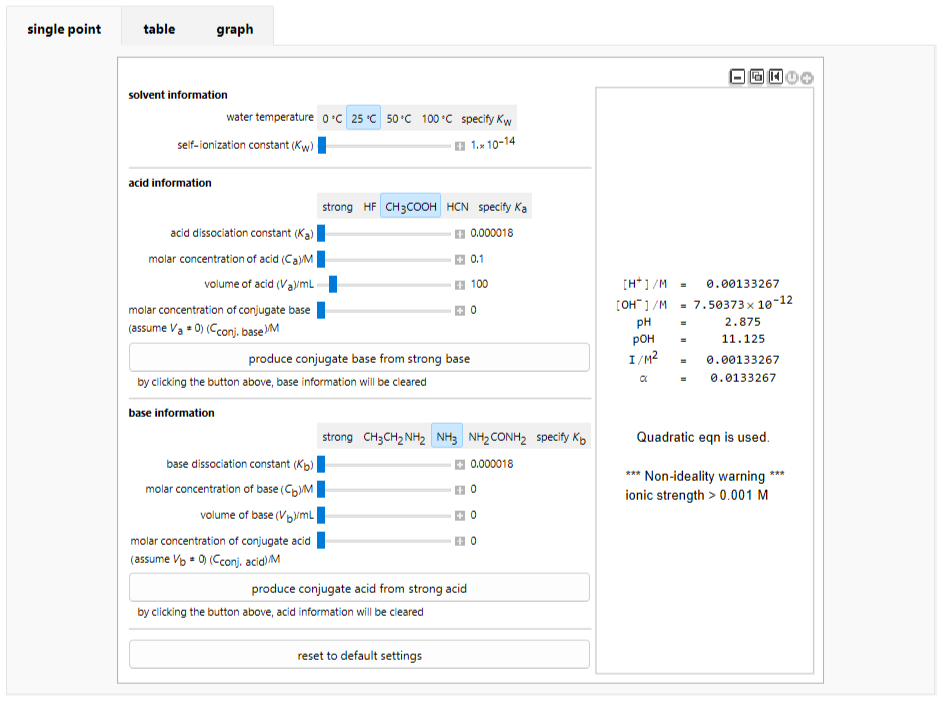
In the single point tab, input parameters including solvent, acid and base information can be filled. The output box shows the calculation results, including what equation was used, and warnings if applicable. This data is saved and displayed in the table tab, where input parameters and calculation results are listed for each trial. Rows are added to the table by entering new input parameters in the single point tab. Every change to the input adds a new row to the table. In the table tab, specific parameters (columns) can be selected to be displayed, and specific rows can be deleted. The graph tab displays a scatter plot of two selected columns in the table tab. Both axes of the plot can be selected to be in linear (none) or log scale.
CITE THIS NOTEBOOK
CITE THIS NOTEBOOK
Exact calculation and visualization of pH in monoprotic acid and base solutions
by Weerapat Chiranon, Sopanant Datta, Junming Ho and Taweetham Limpanuparb (in alphabetical order)
Wolfram Community, STAFF PICKS, September 7, 2023
https://community.wolfram.com/groups/-/m/t/3007894
by Weerapat Chiranon, Sopanant Datta, Junming Ho and Taweetham Limpanuparb (in alphabetical order)
Wolfram Community, STAFF PICKS, September 7, 2023
https://community.wolfram.com/groups/-/m/t/3007894