Computation of the thermal efficiency of a Rankine Cycle
Authors: Housam Binous and Ahmed Bellagi
Computation of the thermal efficiency of a Rankine Cycle
Authors: Housam Binous and Ahmed Bellagi
Authors: Housam Binous and Ahmed Bellagi
We treat here Example 8.1 from Smith et al. (2018).
Steam generated in a power plant at a pressure of 8600 kPa and a temperature of 500 °C is fed to a turbine.
Exhaust from the turbine enters a condenser at 10 kPa, where it is condensed to saturated liquid, which is then pumped to the boiler.
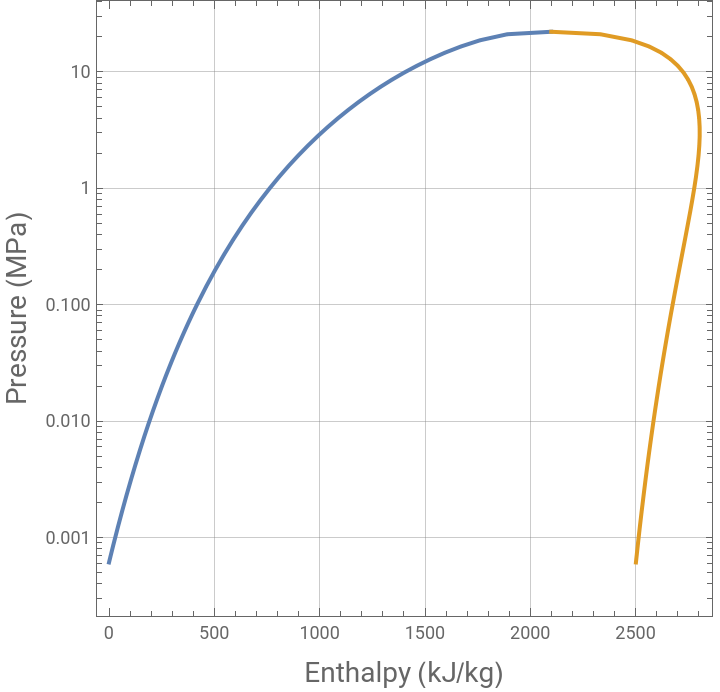
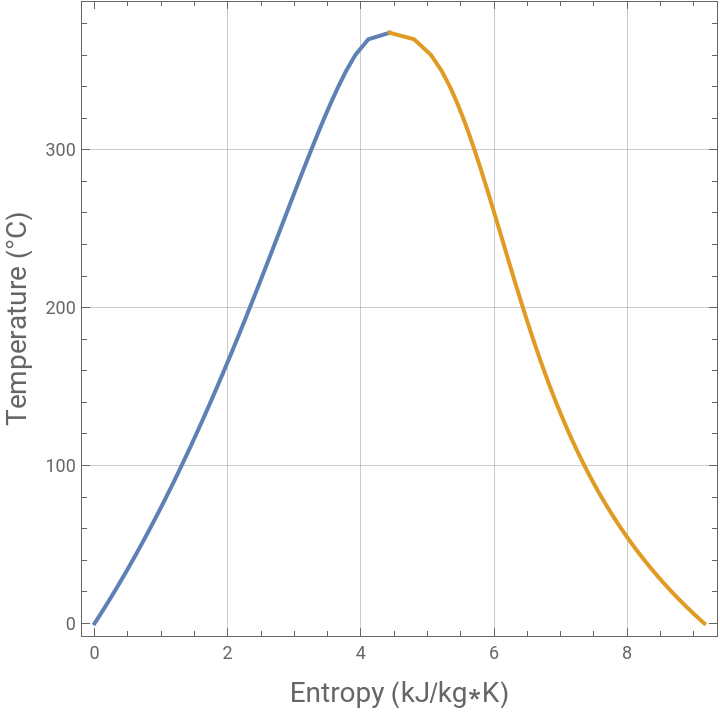
We propose to plot the transformations in the H-P and T-S diagrams and to compute the thermal efficiency of the Rankine cycle.
Reference : SMITH et al . 2018 - INTRODUCTION TO CHEMICAL ENGINEERING THERMODYNAMICS, EIGHTH EDITION
In[]:=
data={{T,°C,P,MPa,vf,vg,uf,ug,hf,hfg,hg,sf,sfg,sg},{SOURCES:Keenan,Keyes,Hill,andMoore,SteamTables,Wiley,NewYork,1969;G.J.VanWylenandR.E.Sonntag,FundamentalsofClassicalThermodynamics,Wiley,NewYork,1973.,,,,,,,,,,,},{0.010,0.0006113,0.001000,206.1,0.0,2375.3,0.0,2501.3,2501.3,0.0000,9.1571,9.1571},{2.,0.0007056,0.001000,179.9,8.4,2378.1,8.4,2496.6,2505.0,0.0305,9.0738,9.1043},{5.,0.0008721,0.001000,147.1,21.0,2382.2,21.0,2489.5,2510.5,0.0761,8.9505,9.0266},{10.,0.001228,0.001000,106.4,42.0,2389.2,42.0,2477.7,2519.7,0.1510,8.7506,8.9016},{15.,0.001705,0.001001,77.93,63.0,2396.0,63.0,2465.9,2528.9,0.2244,8.5578,8.7822},{20.,0.002338,0.001002,57.79,83.9,2402.9,83.9,2454.2,2538.1,0.2965,8.3715,8.6680},{25.,0.003169,0.001003,43.36,104.9,2409.8,104.9,2442.3,2547.2,0.3672,8.1916,8.5588},{30.,0.004246,0.001004,32.90,125.8,2416.6,125.8,2430.4,2556.2,0.4367,8.0174,8.4541},{35.,0.005628,0.001006,25.22,146.7,2423.4,146.7,2418.6,2565.3,0.5051,7.8488,8.3539},{40.,0.007383,0.001008,19.52,167.5,2430.1,167.5,2406.8,2574.3,0.5723,7.6855,8.2578},{45.,0.009593,0.001010,15.26,188.4,2436.8,188.4,2394.8,2583.2,0.6385,7.5271,8.1656},{50.,0.01235,0.001012,12.03,209.3,2443.5,209.3,2382.8,2592.1,0.7036,7.3735,8.0771},{55.,0.01576,0.001015,9.569,230.2,2450.1,230.2,2370.7,2600.9,0.7678,7.2243,7.9921},{60.,0.01994,0.001017,7.671,251.1,2456.6,251.1,2358.5,2609.6,0.8310,7.0794,7.9104},{65.,0.02503,0.001020,6.197,272.0,2463.1,272.0,2346.2,2618.2,0.8934,6.9384,7.8318},{70.,0.03119,0.001023,5.042,292.9,2469.5,293.0,2333.8,2626.8,0.9549,6.8012,7.7561},{75.,0.03858,0.001026,4.131,313.9,2475.9,313.9,2321.4,2635.3,1.0155,6.6678,7.6833},{80.,0.04739,0.001029,3.407,334.8,2482.2,334.9,2308.8,2643.7,1.0754,6.5376,7.6130},{85.,0.05783,0.001032,2.828,355.8,2488.4,355.9,2296.0,2651.9,1.1344,6.4109,7.5453},{90.,0.07013,0.001036,2.361,376.8,2494.5,376.9,2283.2,2660.1,1.1927,6.2872,7.4799},{95.,0.08455,0.001040,1.982,397.9,2500.6,397.9,2270.2,2668.1,1.2503,6.1664,7.4167},{100.,0.1013,0.001044,1.673,418.9,2506.5,419.0,2257.0,2676.0,1.3071,6.0486,7.3557},{110.,0.1433,0.001052,1.210,461.1,2518.1,461.3,2230.2,2691.5,1.4188,5.8207,7.2395},{120.,0.1985,0.001060,0.8919,503.5,2529.2,503.7,2202.6,2706.3,1.5280,5.6024,7.1304},{130.,0.2701,0.001070,0.6685,546.0,2539.9,546.3,2174.2,2720.5,1.6348,5.3929,7.0277},{140.,0.3613,0.001080,0.5089,588.7,2550.0,589.1,2144.8,2733.9,1.7395,5.1912,6.9307},{150.,0.4758,0.001090,0.3928,631.7,2559.5,632.2,2114.2,2746.4,1.8422,4.9965,6.8387},{160.,0.6178,0.001102,0.3071,674.9,2568.4,675.5,2082.6,2758.1,1.9431,4.8079,6.7510},{170.,0.7916,0.001114,0.2428,718.3,2576.5,719.2,2049.5,2768.7,2.0423,4.6249,6.6672},{180.,1.002,0.001127,0.1941,762.1,2583.7,763.2,2015.0,2778.2,2.1400,4.4466,6.5866},{190.,1.254,0.001141,0.1565,806.2,2590.0,807.5,1978.8,2786.4,2.2363,4.2724,6.5087},{200.,1.554,0.001156,0.1274,850.6,2595.3,852.4,1940.8,2793.2,2.3313,4.1018,6.4331},{210.,1.906,0.001173,0.1044,895.5,2599.4,897.7,1900.8,2798.5,2.4253,3.9340,6.3593},{220.,2.318,0.001190,0.08620,940.9,2602.4,943.6,1858.5,2802.1,2.5183,3.7686,6.2869},{230.,2.795,0.001209,0.07159,986.7,2603.9,990.1,1813.9,2804.0,2.6105,3.6050,6.2155},{240.,3.344,0.001229,0.05977,1033.2,2604.0,1037.3,1766.5,2803.8,2.7021,3.4425,6.1446},{250.,3.973,0.001251,0.05013,1080.4,2602.4,1085.3,1716.2,2801.5,2.7933,3.2805,6.0738},{260.,4.688,0.001276,0.04221,1128.4,2599.0,1134.4,1662.5,2796.9,2.8844,3.1184,6.0028},{270.,5.498,0.001302,0.03565,1177.3,2593.7,1184.5,1605.2,2789.7,2.9757,2.9553,5.9310},{280.,6.411,0.001332,0.03017,1227.4,2586.1,1236.0,1543.6,2779.6,3.0674,2.7905,5.8579},{290.,7.436,0.001366,0.02557,1278.9,2576.0,1289.0,1477.2,2766.2,3.1600,2.6230,5.7830},{300.,8.580,0.001404,0.02168,1332.0,2563.0,1344.0,1405.0,2749.0,3.2540,2.4513,5.7053},{310.,9.856,0.001447,0.01835,1387.0,2546.4,1401.3,1326.0,2727.3,3.3500,2.2739,5.6239},{320.,11.27,0.001499,0.01549,1444.6,2525.5,1461.4,1238.7,2700.1,3.4487,2.0883,5.5370},{330.,12.84,0.001561,0.01300,1505.2,2499.0,1525.3,1140.6,2665.9,3.5514,1.8911,5.4425},{340.,14.59,0.001638,0.01080,1570.3,2464.6,1594.2,1027.9,2622.1,3.6601,1.6765,5.3366},{350.,16.51,0.001740,0.008815,1641.8,2418.5,1670.6,893.4,2564.0,3.7784,1.4338,5.2122},{360.,18.65,0.001892,0.006947,1725.2,2351.6,1760.5,720.7,2481.2,3.9154,1.1382,5.0536},{370.,21.03,0.002213,0.004931,1844.0,2229.0,1890.5,442.2,2332.7,4.1114,0.6876,4.7990},{374.136,22.088,0.003155,0.003155,2029.6,2029.6,2099.3,0.0,2099.3,4.4305,0.0000,4.4305}};
In[]:=
data[[1]]
Out[]=
{T,°C,P,MPa,vf,vg,uf,ug,hf,hfg,hg,sf,sfg,sg}
In[]:=
phl=Table[{data[[i]][[7]],data[[i]][[2]]},{i,3,Length[data]-2}]
Out[]=
{{0.,0.0006113},{8.4,0.0007056},{21.,0.0008721},{42.,0.001228},{63.,0.001705},{83.9,0.002338},{104.9,0.003169},{125.8,0.004246},{146.7,0.005628},{167.5,0.007383},{188.4,0.009593},{209.3,0.01235},{230.2,0.01576},{251.1,0.01994},{272.,0.02503},{293.,0.03119},{313.9,0.03858},{334.9,0.04739},{355.9,0.05783},{376.9,0.07013},{397.9,0.08455},{419.,0.1013},{461.3,0.1433},{503.7,0.1985},{546.3,0.2701},{589.1,0.3613},{632.2,0.4758},{675.5,0.6178},{719.2,0.7916},{763.2,1.002},{807.5,1.254},{852.4,1.554},{897.7,1.906},{943.6,2.318},{990.1,2.795},{1037.3,3.344},{1085.3,3.973},{1134.4,4.688},{1184.5,5.498},{1236.,6.411},{1289.,7.436},{1344.,8.58},{1401.3,9.856},{1461.4,11.27},{1525.3,12.84},{1594.2,14.59},{1670.6,16.51},{1760.5,18.65}}
In[]:=
phl={{0.0,0.0006113},{8.4,0.0007056},{21.0,0.0008721},{42.0,0.001228},{63.0,0.001705},{83.9,0.002338},{104.9,0.003169},{125.8,0.004246},{146.7,0.005628},{167.5,0.007383},{188.4,0.009593},{209.3,0.01235},{230.2,0.01576},{251.1,0.01994},{272.0,0.02503},{293.0,0.03119},{313.9,0.03858},{334.9,0.04739},{355.9,0.05783},{376.9,0.07013},{397.9,0.08455},{419.0,0.1013},{461.3,0.1433},{503.7,0.1985},{546.3,0.2701},{589.1,0.3613},{632.2,0.4758},{675.5,0.6178},{719.2,0.7916},{763.2,1.002},{807.5,1.254},{852.4,1.554},{897.7,1.906},{943.6,2.318},{990.1,2.795},{1037.3,3.344},{1085.3,3.973},{1134.4,4.688},{1184.5,5.498},{1236.0,6.411},{1289.0,7.436},{1344.0,8.580},{1401.3,9.856},{1461.4,11.27},{1525.3,12.84},{1594.2,14.59},{1670.6,16.51},{1760.5,18.65},{1890.5,21.03},{2099.3,22.088}};
In[]:=
phv=Table[{data[[i]][[9]],data[[i]][[2]]},{i,3,Length[data]-2}]
Out[]=
{{2501.3,0.0006113},{2505.,0.0007056},{2510.5,0.0008721},{2519.7,0.001228},{2528.9,0.001705},{2538.1,0.002338},{2547.2,0.003169},{2556.2,0.004246},{2565.3,0.005628},{2574.3,0.007383},{2583.2,0.009593},{2592.1,0.01235},{2600.9,0.01576},{2609.6,0.01994},{2618.2,0.02503},{2626.8,0.03119},{2635.3,0.03858},{2643.7,0.04739},{2651.9,0.05783},{2660.1,0.07013},{2668.1,0.08455},{2676.,0.1013},{2691.5,0.1433},{2706.3,0.1985},{2720.5,0.2701},{2733.9,0.3613},{2746.4,0.4758},{2758.1,0.6178},{2768.7,0.7916},{2778.2,1.002},{2786.4,1.254},{2793.2,1.554},{2798.5,1.906},{2802.1,2.318},{2804.,2.795},{2803.8,3.344},{2801.5,3.973},{2796.9,4.688},{2789.7,5.498},{2779.6,6.411},{2766.2,7.436},{2749.,8.58},{2727.3,9.856},{2700.1,11.27},{2665.9,12.84},{2622.1,14.59},{2564.,16.51},{2481.2,18.65}}
In[]:=
phv={{2501.3,0.0006113},{2505.0,0.0007056},{2510.5,0.0008721},{2519.7,0.001228},{2528.9,0.001705},{2538.1,0.002338},{2547.2,0.003169},{2556.2,0.004246},{2565.3,0.005628},{2574.3,0.007383},{2583.2,0.009593},{2592.1,0.01235},{2600.9,0.01576},{2609.6,0.01994},{2618.2,0.02503},{2626.8,0.03119},{2635.3,0.03858},{2643.7,0.04739},{2651.9,0.05783},{2660.1,0.07013},{2668.1,0.08455},{2676.0,0.1013},{2691.5,0.1433},{2706.3,0.1985},{2720.5,0.2701},{2733.9,0.3613},{2746.4,0.4758},{2758.1,0.6178},{2768.7,0.7916},{2778.2,1.002},{2786.4,1.254},{2793.2,1.554},{2798.5,1.906},{2802.1,2.318},{2804.0,2.795},{2803.8,3.344},{2801.5,3.973},{2796.9,4.688},{2789.7,5.498},{2779.6,6.411},{2766.2,7.436},{2749.0,8.580},{2727.3,9.856},{2700.1,11.27},{2665.9,12.84},{2622.1,14.59},{2564.0,16.51},{2481.2,18.65},{2332.7,21.03},{2099.3,22.088}};
In[]:=
Tsl=Table[{data[[i]][[10]],data[[i]][[1]]},{i,3,Length[data]-2}]
Out[]=
{{0.,0.01},{0.0305,2.},{0.0761,5.},{0.151,10.},{0.2244,15.},{0.2965,20.},{0.3672,25.},{0.4367,30.},{0.5051,35.},{0.5723,40.},{0.6385,45.},{0.7036,50.},{0.7678,55.},{0.831,60.},{0.8934,65.},{0.9549,70.},{1.0155,75.},{1.0754,80.},{1.1344,85.},{1.1927,90.},{1.2503,95.},{1.3071,100.},{1.4188,110.},{1.528,120.},{1.6348,130.},{1.7395,140.},{1.8422,150.},{1.9431,160.},{2.0423,170.},{2.14,180.},{2.2363,190.},{2.3313,200.},{2.4253,210.},{2.5183,220.},{2.6105,230.},{2.7021,240.},{2.7933,250.},{2.8844,260.},{2.9757,270.},{3.0674,280.},{3.16,290.},{3.254,300.},{3.35,310.},{3.4487,320.},{3.5514,330.},{3.6601,340.},{3.7784,350.},{3.9154,360.}}
In[]:=
Tsl={{0.0000,0.010},{0.0305,2.},{0.0761,5.},{0.1510,10.},{0.2244,15.},{0.2965,20.},{0.3672,25.},{0.4367,30.},{0.5051,35.},{0.5723,40.},{0.6385,45.},{0.7036,50.},{0.7678,55.},{0.8310,60.},{0.8934,65.},{0.9549,70.},{1.0155,75.},{1.0754,80.},{1.1344,85.},{1.1927,90.},{1.2503,95.},{1.3071,100.},{1.4188,110.},{1.5280,120.},{1.6348,130.},{1.7395,140.},{1.8422,150.},{1.9431,160.},{2.0423,170.},{2.1400,180.},{2.2363,190.},{2.3313,200.},{2.4253,210.},{2.5183,220.},{2.6105,230.},{2.7021,240.},{2.7933,250.},{2.8844,260.},{2.9757,270.},{3.0674,280.},{3.1600,290.},{3.2540,300.},{3.3500,310.},{3.4487,320.},{3.5514,330.},{3.6601,340.},{3.7784,350.},{3.9154,360.},{4.1114,370.},{4.4305,374.136}};
In[]:=
Tsv=Table[{data[[i]][[12]],data[[i]][[1]]},{i,3,Length[data]-2}]
Out[]=
{{9.1571,0.01},{9.1043,2.},{9.0266,5.},{8.9016,10.},{8.7822,15.},{8.668,20.},{8.5588,25.},{8.4541,30.},{8.3539,35.},{8.2578,40.},{8.1656,45.},{8.0771,50.},{7.9921,55.},{7.9104,60.},{7.8318,65.},{7.7561,70.},{7.6833,75.},{7.613,80.},{7.5453,85.},{7.4799,90.},{7.4167,95.},{7.3557,100.},{7.2395,110.},{7.1304,120.},{7.0277,130.},{6.9307,140.},{6.8387,150.},{6.751,160.},{6.6672,170.},{6.5866,180.},{6.5087,190.},{6.4331,200.},{6.3593,210.},{6.2869,220.},{6.2155,230.},{6.1446,240.},{6.0738,250.},{6.0028,260.},{5.931,270.},{5.8579,280.},{5.783,290.},{5.7053,300.},{5.6239,310.},{5.537,320.},{5.4425,330.},{5.3366,340.},{5.2122,350.},{5.0536,360.}}
In[]:=
Tsv={{9.1571,0.010},{9.1043,2.},{9.0266,5.},{8.9016,10.},{8.7822,15.},{8.6680,20.},{8.5588,25.},{8.4541,30.},{8.3539,35.},{8.2578,40.},{8.1656,45.},{8.0771,50.},{7.9921,55.},{7.9104,60.},{7.8318,65.},{7.7561,70.},{7.6833,75.},{7.6130,80.},{7.5453,85.},{7.4799,90.},{7.4167,95.},{7.3557,100.},{7.2395,110.},{7.1304,120.},{7.0277,130.},{6.9307,140.},{6.8387,150.},{6.7510,160.},{6.6672,170.},{6.5866,180.},{6.5087,190.},{6.4331,200.},{6.3593,210.},{6.2869,220.},{6.2155,230.},{6.1446,240.},{6.0738,250.},{6.0028,260.},{5.9310,270.},{5.8579,280.},{5.7830,290.},{5.7053,300.},{5.6239,310.},{5.5370,320.},{5.4425,330.},{5.3366,340.},{5.2122,350.},{5.0536,360.},{4.7990,370.},{4.4305,374.136}};
H - P diagram
In[]:=
plt=ListLogPlot[{phl,phv},PlotStyleThick,JoinedTrue,FrameTrue,AspectRatio1,GridLinesAutomatic,FrameLabel{Style["Enthalpy (kJ/kg)",14],Style["Pressure (MPa)",14]}]
Out[]=
T - S diagram
In[]:=
plt2=ListPlot[{Tsl,Tsv},PlotStyleThick,JoinedTrue,FrameTrue,AspectRatio1,GridLinesAutomatic,FrameLabel{Style["Entropy (kJ/kg*K)",14],Style["Temperature (°C)",14]}]
Out[]=
In[]:=
In[]:=
dataNeil[[1]]
Out[]=
T°C,MPaP,,,,,,,,EnthalpyofVaporization,EntropyLiquid,EntropyVapor,EntropyofVaporization,,SpecificVaporVolume
DensitykgLiquid
3
m
DensitykgVapor
3
m
EnergyInternalkJLiquid
kg
EnergyInternalkJVapor
kg
EnergyInternalkJofVaporization
kg
EnthalpykJLiquid
kg
EnthalpykJVapor
kg
kJ
Kkg
kJ
Kkg
LiquidSpecificVolume
3
m
kg
3
m
kg
H - P diagram using data from Neil Hendren
H - P diagram using data from the two sets of data given above
T - S diagram using data from Neil Hendren
T - S diagram using data from the two sets of data given above
SUPERHEATED STEAM from from Neil Hendren
SUPERHEATED STEAM from from Neil Hendren
SUBCOOLED Liquid data from Neil Hendren
SUBCOOLED Liquid data from Neil Hendren
Pressure - Enthalpy Diagram for Water including the isotherm for 100 °C
Pressure - Enthalpy Diagram for Water including the isotherm for 100 °C
Temperature - Entropy Diagram for Water including the isobar for 1 bar
Temperature - Entropy Diagram for Water including the isobar for 1 bar
General information about the Rankine Cycle
Let us determine H4
SUBCOOLED ENTROPY AND ENTHALPY DATA from Neil Hendren
Let us determine T4
Let us determine T1. Note that P1=8600 kPa is given in the problem statement. we need to compute ΔT due to compression of liquid water in the pump.
T1=T4+ΔT
T1=T4+ΔT
Let us determine H1
Let us determine the enthalpies of saturated liquid and saturated vapor at 8600 kPa
Let us determine H2 (SUPERHEATED VAPOR @ 8600 kPa and 500°C
Both transformations 14 and 32 are adiabatic (isentropic).
We have previously computed T4 value
Let us determine S4
Temperatures T1, T2, T3 AND T4
Quality @ point 3 (wet exhaust from the turbine) is equal to 0.8048
Enthalpy of saturated vapor @ 10 kPa
Enthalpy @ point 4 obtained previously
Enthalpy @ point 3
Rankine cycle shown in the P - H diagram
Rankine cycle shown in the T - S diagram
The thermal efficiency of the Rankine cycle is : η = 39.66 %
The values found in the coding below are in agreement with their counterparts given in the textbook by Smith et. al.
The values found in the coding below are in agreement with their counterparts given in the textbook by Smith et. al.