Part 1 of 5—a winter-wheat field outside Linköping
How do you make a digital twin with Wolfram System Modeler and Wolfram Language?
Customers ask me this often. Over five parts I will answer it with five different examples.
This first part is a digital twin of a winter-wheat field outside Linköping.
A digital twin, as I understand it, is a digital model of a physical system, synced using sensor data.
So in this workflow we will see how to fetch data, use a system model for prediction and finally use the data to sync the model to the field.
1. The case study
1. The case study
Winter wheat is sown in September and harvested the next August. This twin’s job is to tell the farmer, every day, when the crop will flower, when it will be ready to harvest and how much it will yield, and to raise a flag when the field strays from its expected course.
The field, marked, west of Linköping. Declared to Jordbruksverket as höstvete (winter wheat) in 2019, 2020, 2022 and 2025, and havre (oats) in 2024.
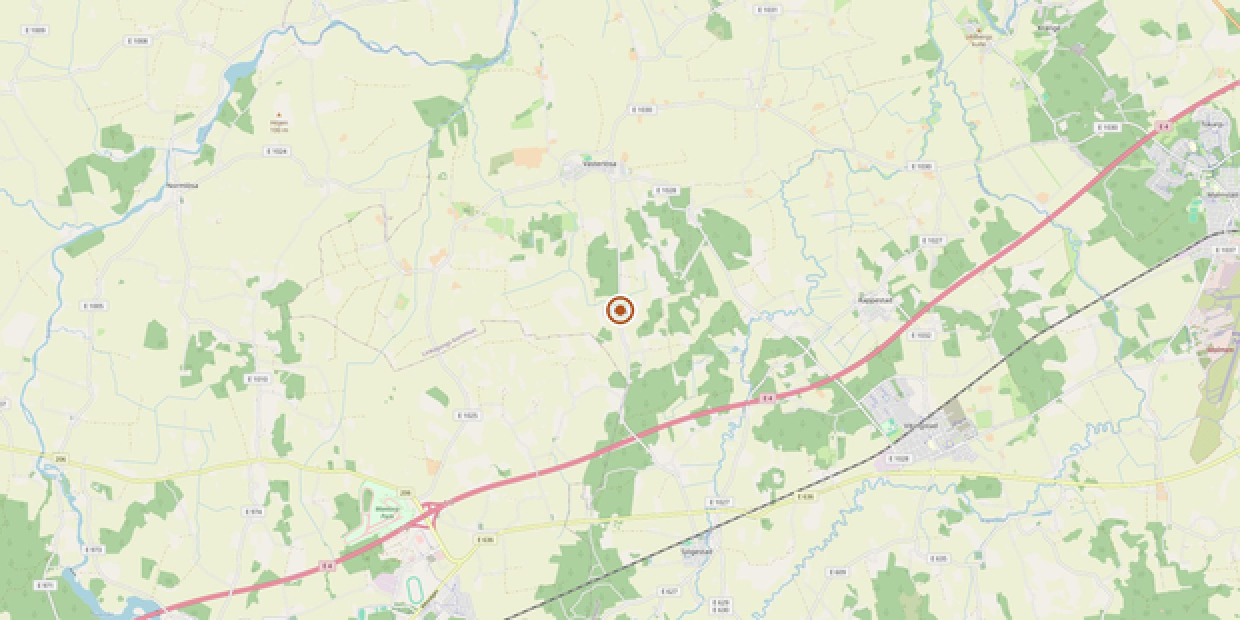
Base map © OpenStreetMap contributors.
2. How to watch it from space
2. How to watch it from space
A satellite like Sentinel-2 watches the field from space. It passes over the field every two to three days and sees 10 m per pixel; the data is free. Here is what it saw on 4 July 2026, rendered as a photo.
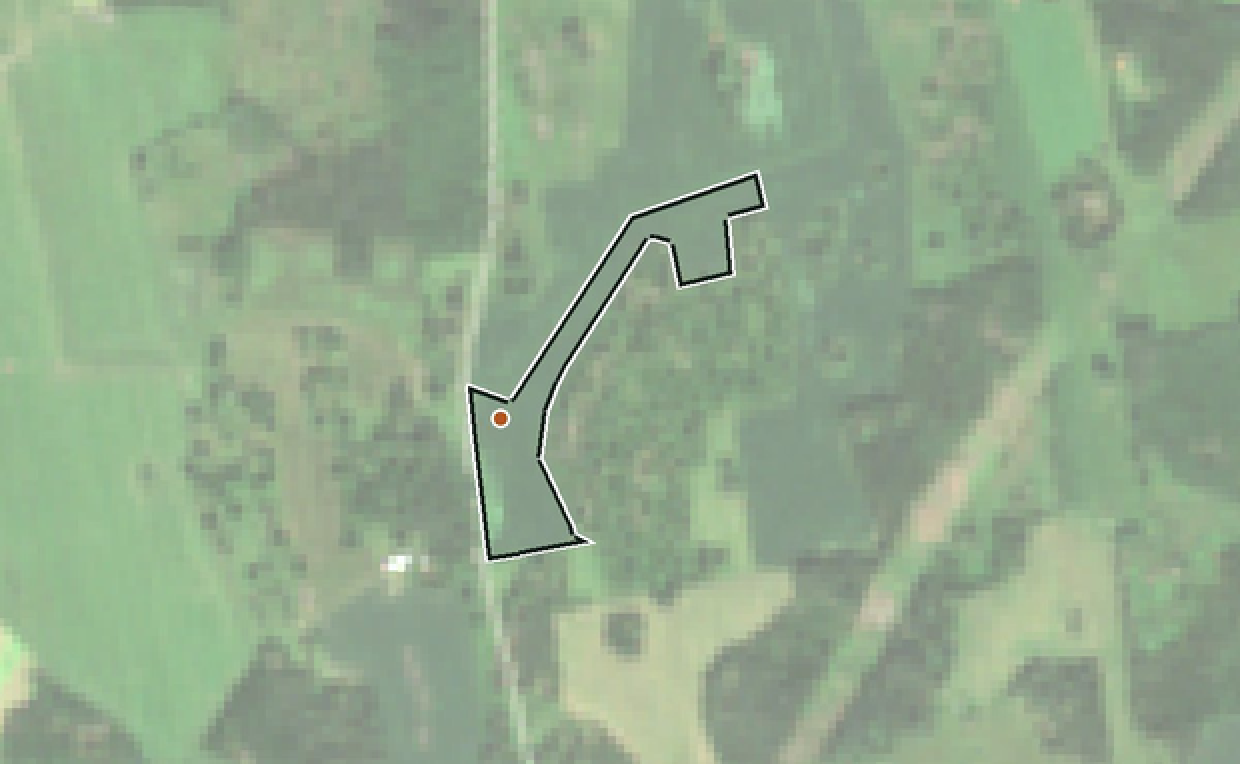
The field (outlined) and its neighbours, 4 July 2026.
The satellite does not only take photos. On every pass it records thirteen colour bands, each a slice of the spectrum, some beyond what the eye can see. We need two of them. From those two we compute a map of the same area, one number per pixel, which I will call the greenness plot. It looks like this.
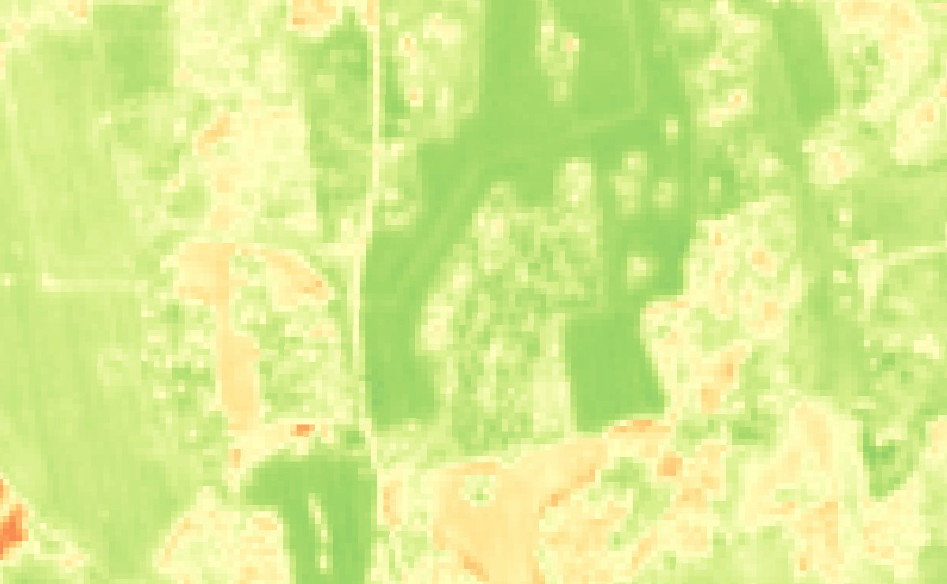
We use the following expression to create this plot,
(B08 - B04) / (B08 + B04)
(B08 - B04) / (B08 + B04)
where,
B08: near-infrared band (842 nm)
B04: red (665 nm)
B08: near-infrared band (842 nm)
B04: red (665 nm)
The expression is the NDVI, the normalised difference vegetation index. A living leaf swallows red light for photosynthesis and throws back near-infrared from its cell structure; bare soil reflects both about equally. The contrast is the NDVI: near 0.2 for bare soil, above 0.9 for a field fully covered by leaf.
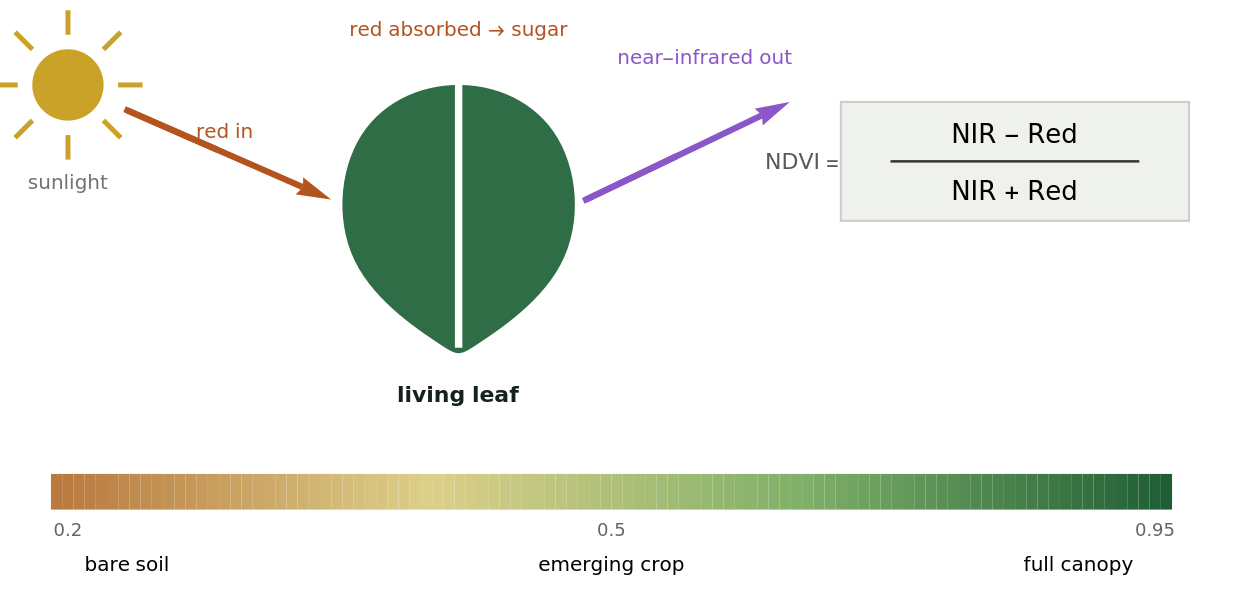
Reflectance is the share of sunlight the ground sends back in each band.
On 22 September 2025, just after sowing:
red 0.061, near-infrared 0.103
NDVI = (0.103 − 0.061) / (0.103 + 0.061) = 0.26, bare soil.
NDVI = (0.103 − 0.061) / (0.103 + 0.061) = 0.26, bare soil.
At the same point on 30 May 2026:
red 0.020, near-infrared 0.469
NDVI = (0.469 − 0.020) / (0.469 + 0.020) = 0.92, a closed canopy.
NDVI = (0.469 − 0.020) / (0.469 + 0.020) = 0.92, a closed canopy.
The leaf swallowed nearly all the red and threw back the infrared. This number, one per clear pass, is what the model is compared against.
Seven passes over the same field:
|
|
|
| ||||||||||||||||||||
|
|
| |
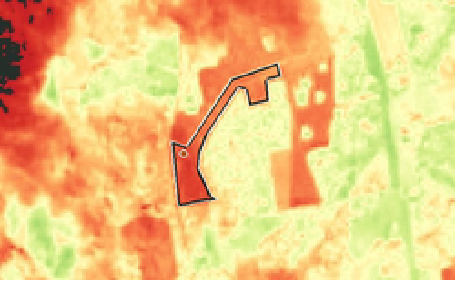
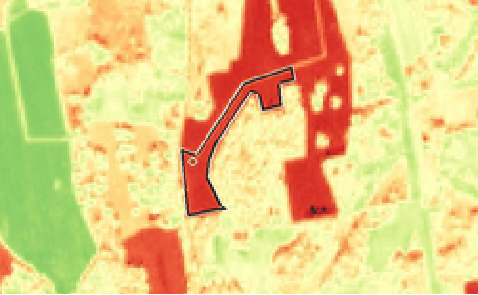
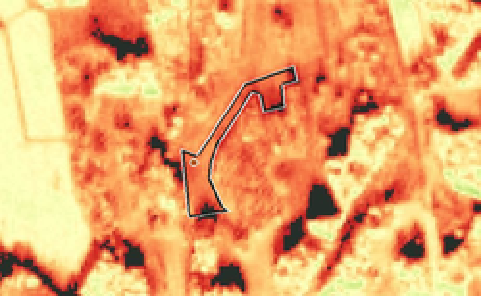
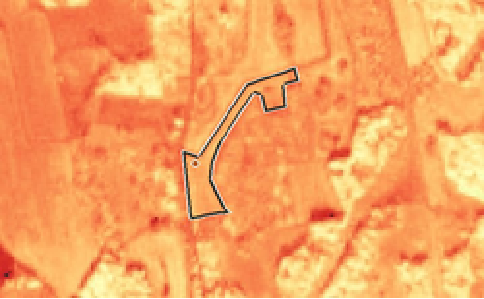
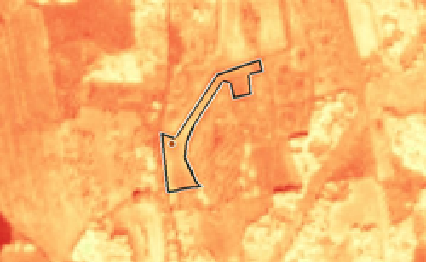
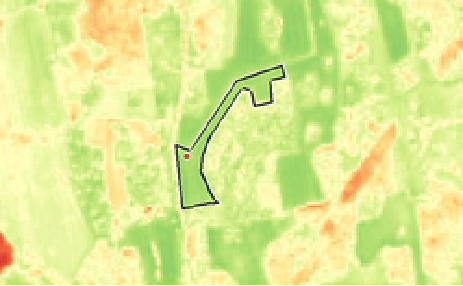
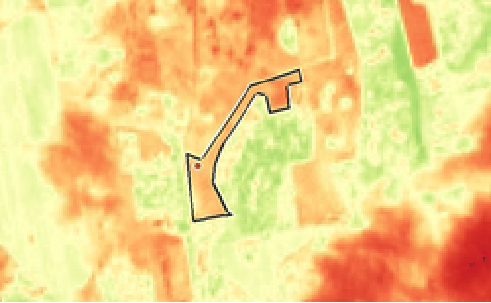
Red is bare, green is dense leaf. Contains modified Copernicus Sentinel data 2025–2026.
Phase | Date | Red | Near-infrared | (NIR − Red) / (NIR + Red) | NDVI |
Stubble after harvest | 22 Sep 2025 | 0.061 | 0.103 | (0.103 − 0.061) / (0.103 + 0.061) | 0.26 |
Sown, nothing up yet | 02 Oct 2025 | 0.088 | 0.140 | (0.140 − 0.088) / (0.140 + 0.088) | 0.23 |
Small plants, autumn | 24 Nov 2025 | 0.167 | 0.289 | (0.289 − 0.167) / (0.289 + 0.167) | 0.27 |
First image after winter | 06 Mar 2026 | 0.063 | 0.182 | (0.182 − 0.063) / (0.182 + 0.063) | 0.49 |
Spring growth | 09 Apr 2026 | 0.092 | 0.236 | (0.236 − 0.092) / (0.236 + 0.092) | 0.44 |
Peak canopy | 30 May 2026 | 0.020 | 0.469 | (0.469 − 0.020) / (0.469 + 0.020) | 0.92 |
Ripening and harvest | 11 Aug 2026 | 0.149 | 0.402 | (0.402 − 0.149) / (0.402 + 0.149) | 0.46 |
The same seven readings as a table. Low red is the signature of living leaf; high near-infrared is its cell structure.
3. What drives the growth
3. What drives the growth
◼
Light: the part a plant can use is 400–700 nm, called PAR. Roughly 3 g of dry matter is created per MJ of energy intercepted.
◼
Temperature. A crop counts warmth. Each day adds its mean temperature above 0 °C to a running total: a day at 10 °C adds 10, a day at −3 °C adds 0.
◼
That total is thermal time, in degree-days (°C·d). Every stage arrives at a set amount of it
◼
this wheat flowers at about 1800 °C·d.
◼
A warm spring reaches it in May, a cold one in June.
◼
Over winter the total barely moves, which is the flat part of the curve below.
◼
Soil water. The root zone holds water like a bucket.
◼
Rain fills it; the crop consumes it and the soil breathes it out (together, evapotranspiration); anything above what the soil can hold drains away.
◼
Growth slows when the level falls low.
Stages follow the thermal clock, not the calendar:
◼
emergence, tillering, a near-standstill over winter, the fast spring growth, flowering at about 1800 °C·d, then grain fill and harvest.
Thermal time for harvest 2026 with the stages marked. The winter is the flat part where the clock is paused.
4. Data from reliable sources
4. Data from reliable sources
Weather comes from SMHI, Sweden’s meteorological institute, whose station 85240 at Malmslätt is 13 km from the field.
Sunlight comes from STRÅNG, SMHI’s radiation model, at the field’s coordinates; parameter 120 is the part plants can use, PAR, in MJ/m² per day.
A scene is one satellite image of one pass, about 100 km across; we search for every scene that contains the field.
Take the newest scene and ask for the two bands from the NDVI formula and the scene class at the field:
Three numbers: red, near-infrared, scene class. The first two are not the reflectances like 0.061 and 0.103 we used above. The archive stores each band as an integer, the reflectance times 10 000, and since 2022 (processing baseline 04.00) with 1000 added on top. So:
The third number, 4, is the scene class at the location: 4 means vegetation, 5 bare soil, and the others are cloud, cloud shadow, snow or water.
Reflectance is only “what the ground sends back” if the satellite saw the ground, so a pass is kept only when the class is 4 or 5. That is the cloud mask.
Reflectance is only “what the ground sends back” if the satellite saw the ground, so a pass is kept only when the class is 4 or 5. That is the cloud mask.
9 and 22 September appear twice: the field lies where two tiles overlap, so one pass yields two scenes. The daily run averages them.
5. Modelling the crop as a system
5. Modelling the crop as a system
Here is the crop year as a flow diagram, the process the model has to reproduce:
The crop growth can be modeled using the concept of system dynamics, where a stock is something that accumulates, a flow is a rate that fills or drains it. Soil water, green leaf, dry matter and thermal time are the stocks.
One subsystem in full, the soil-water bucket. Purple is water, blue is information.
Rain from the cloud at left fills the stock;
evapotranspiration leaves to the right,
drainage drops out below.
Rain from the cloud at left fills the stock;
evapotranspiration leaves to the right,
drainage drops out below.
The bus at top right brings in rain, sunlight and canopy cover, and takes back the water stress read from the level at bottom right.
Diagram in System Modeler created with the Business Simulation Library.
Leaf works the same way.
Light the canopy catches becomes sugar; a share of that becomes new leaf, which catches more light: until the canopy intercepts nearly all of it and the loop starves.
After flowering the same stock drains as the canopy yellows.
Light the canopy catches becomes sugar; a share of that becomes new leaf, which catches more light: until the canopy intercepts nearly all of it and the loop starves.
After flowering the same stock drains as the canopy yellows.
Here is a simulation of the model for a year:
6. Does it hold up?
6. Does it hold up?
Five completed seasons, the model driven by weather alone, the satellite as the data source:
Filled dots were used to calibrate the sowing date; hollow dots are low-sun passes, excluded.
7. The sync: the satellite corrects the model
7. The sync: the satellite corrects the model
So far the satellite data has only been laid over the model.
A twin needs the data to change the model, because no model represents every factor at work in the field; it has to be corrected toward what is actually there.
After every clear pass, the twin pulls its leaf area toward what the satellite implies, over two days.
(It is one extra flow into the leaf stock: nudging, the simplest form of data assimilation.)
A corrected state restarts the forecast from the field as it is.
Four completed seasons replayed pass by pass: the model is given only the passes up to each day and scored on the sixty days that follow. Top: model alone (dotted), twin (solid), satellite (dots). Bottom: error over the next sixty days. On the passes themselves the twin is closer in three seasons of four: best in 2026 (0.106 → 0.067), and 2019 is the exception (0.076 → 0.078).
Once we have the twin, it can be used to support decisions, every day:
◼
flowering and harvest-ready dates, as ranges over five weather years, re-issued every day so you can watch them settle — today 17 June and 8 August 2027
◼
grain yield, twin and model alone — today about 7.8–9.3 t/ha at 14 % moisture, taken as 0.45 of the 14.9–17.8 t/ha of above-ground dry matter the model computes. Issued in September, before the crop has emerged, it is still climatology: the range is the five weather years.
◼
a divergence alert when a pass lands more than 2.5 standard deviations from what the twin expected the day before, and one line saying what to do
Each day's line goes to the Databin and to a sync log, so the loop can be audited.
8. Keeping the numbers in the cloud
8. Keeping the numbers in the cloud
The simulation needs System Modeler, so it runs on one computer once a day. The result goes to a Wolfram Databin, so the dashboard can read it from any browser. The daily script writes the full entry; here is its shape, from the live season with the sync on, into a scratch bin:
9. A dashboard, with your favourite LLM
9. A dashboard, with your favourite LLM
Decide what matters here: the field itself, what the satellite sees against what the twin expects, what the satellite changed today, the decisions, the warmth accumulated, and the yield the twin foresees.
Then let an LLM write the HTML. The page reads the databin when it opens and can be hosted anywhere.
Last frame of the season animation for harvest 2022: the dotted line is the model alone, weather only; the solid line is the twin, pulled toward each satellite pass as it arrived. Error over the year 0.071 → 0.056. The dashboard replays last season the same way, over the field itself.
replay last season over the field, pause to read, see today's disagreement explained by the model, and watch the expected dates and yield move from one day's issue to the next.
NOTE: Since 22 September 2026 the field has read 0.79 before the crop has emerged, 9.8 standard deviations from what the twin expected.
It leaves the seedling stand uncorrected, by design, and raises the alert instead: most likely stubble or volunteers regrowing, to be worked in before sowing.
It leaves the seedling stand uncorrected, by design, and raises the alert instead: most likely stubble or volunteers regrowing, to be worked in before sowing.
10. Technologies used
10. Technologies used
Weather © SMHI (CC BY 4.0).
Imagery contains modified Copernicus Sentinel data 2025–2026 via the Microsoft Planetary Computer.
Parcel data © Jordbruksverket.
Base map © OpenStreetMap contributors.
Imagery contains modified Copernicus Sentinel data 2025–2026 via the Microsoft Planetary Computer.
Parcel data © Jordbruksverket.
Base map © OpenStreetMap contributors.
CITE THIS NOTEBOOK
CITE THIS NOTEBOOK
Digital twin: tracking crop growth
by Ankit Naik
Wolfram Community, STAFF PICKS, September 25, 2026
https://community.wolfram.com/t/28173
by Ankit Naik
Wolfram Community, STAFF PICKS, September 25, 2026
https://community.wolfram.com/t/28173