Yield curve animation
by R. H. Rimmer, 27 March 2023
Yield curve animation
by R. H. Rimmer, 27 March 2023
by R. H. Rimmer, 27 March 2023
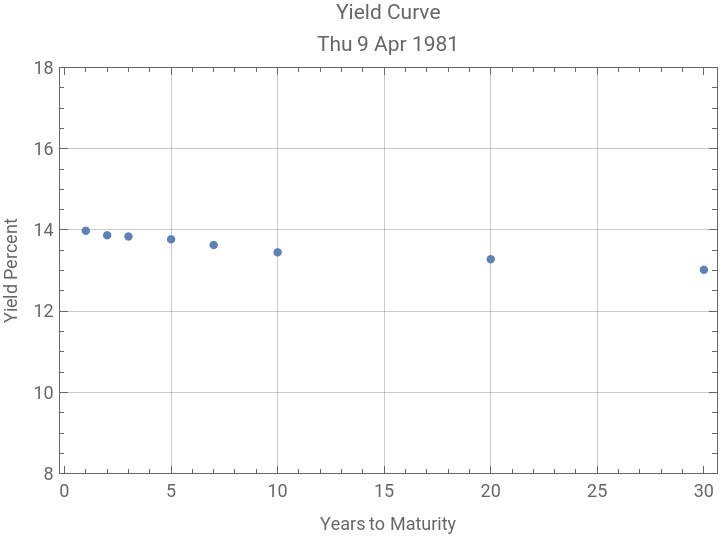
Yield curve history from the last time the FOMC actually subdued inflation. The animation shows how the inverted yield curve in 1981 finally resolved.
Download data from FRED and set up database.
In[]:=
yieldCurve0=Import["https://www.federalreserve.gov/datadownload/Output.aspx?rel=H15&series=bf17364827e38702b42a58cf8eaa3f78&lastobs=&from=&to=&filetype=csv&label=include&layout=seriescolumn&type=package","CSV"];header=Join[{"date"},StringSplit[Rest[yieldCurve0[[1]]]][[All,8]]]yieldCurve={DateObject[#1,"Day"],#2,#3,#4,#5,#6,#7,#8,#9,#10,#11,#12}&@@@yieldCurve0[[7;;]];yieldCurveDS=AssociationThread[header,#]&/@yieldCurve/.""->Missing[]//Dataset;(*1980sdataremovedayswithnodata--ND*)yc80DS=Select[yieldCurveDS,1980<=DateValue[#date,"Year"]<1990&&#"10-year"!="ND"&];
Out[]=
{date,1-month,3-month,6-month,1-year,2-year,3-year,5-year,7-year,10-year,20-year,30-year}
In[]:=
reversionDS=Select[yc80DS,DateObject[{1981},"Day"]<#date<DateObject[{1983},"Day"]&]
Out[]=


In[]:=
times=,,,1,2,3,5,7,10,20,30;
1
12
1
4
1
2
In[]:=
rycData={#[[1]],Select[Transpose[{times,Rest[#]}],#[[2]]=!=Missing[]&]}&/@Values[Normal[reversionDS]];
In[]:=
plotList=ListPlot[rycData[[#]][[2]],Frame->True,FrameLabel->{"Years to Maturity","Yield Percent"},GridLines->Automatic,PlotRange->{All,{8,18}},PlotLabel->"Yield Curve\n"<>DateString[rycData[[#]][[1]]]]&/@Range[Length[rycData]];
The animation starts with an inverted yield curve. There was a deep recession in 1982, but the Fed held rates up until the summer of 1982 despite the recession. The yield curve began to show long rates higher than short term rates in July 1982.
In[]:=
ListAnimate[plotList,6]
Out[]=