Modeling and Analysis
Modeling and Analysis

Getting started with Graphs & Networks
Getting started with Graphs & Networks
What is a Graph?
What is a Graph?
In its simplest form, a graph is a collection of points joined together in pairs by lines.
The points are referred to as vertices and the lines are referred to as edges.
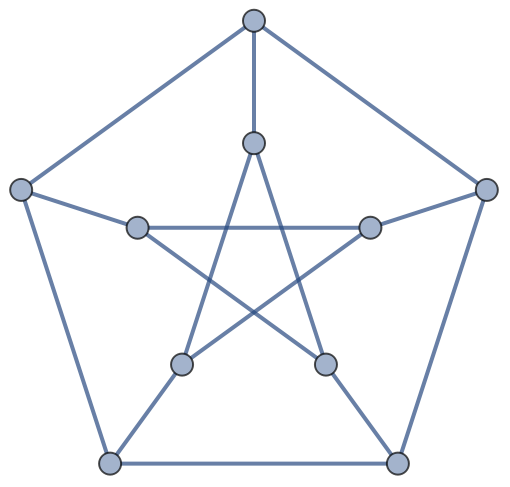
A graph with 10 vertices and 15 edges:
PetersenGraph[5,2,VertexSize0.18,EdgeStyleThick]
What is a Network?
What is a Network?
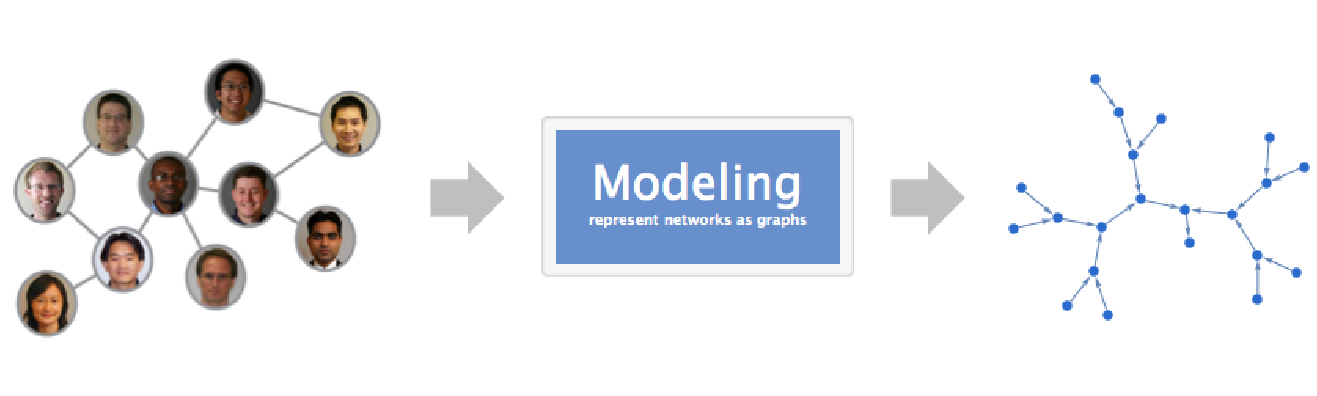
A network is a graph that represents something real with a structure and a behavior.
Vertices are called nodes and the edges are called links.
Different nomenclature in each field.
Computer sciences | network as a system of nodes and links |
Sociology | network as social interactions or ties among actors |
Physics | network as model of phase transition, magnetism,… |
Biology | network as model of epidemics, metabolic systems within cells, … |
Graphs in the Wolfram Language
Graphs in the Wolfram Language
Graph[{,,…}]yieldsagraphwithedges.
e
1
e
2
e
i
An edge between vertices u and v is denoted by u v (u ue v).
In[]:=
UndirectedEdge[u,v]
Out[]=
uv
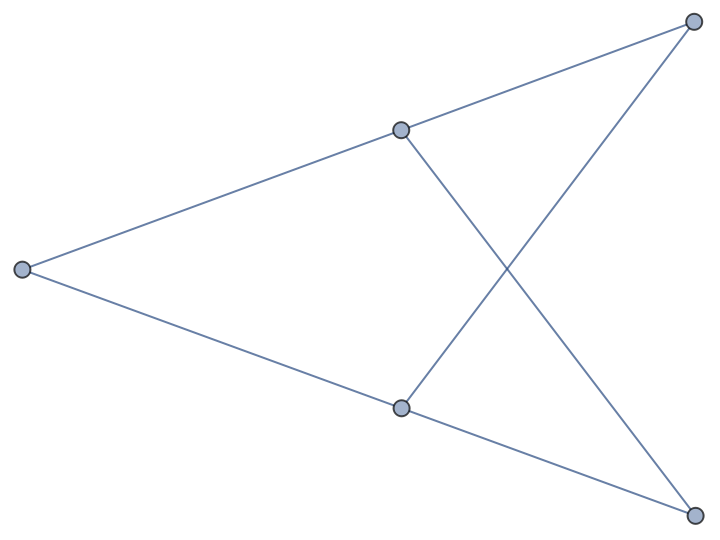
Build a graph from an edge list.
In[]:=
Graph[{13,14,15,23,24,25}]
Out[]=
Directed Graphs
Directed Graphs
A directed edge from vertex u to vertex v is denoted (u de v).
u
v
In[]:=
DirectedEdge[u,v]
Out[]=
uv
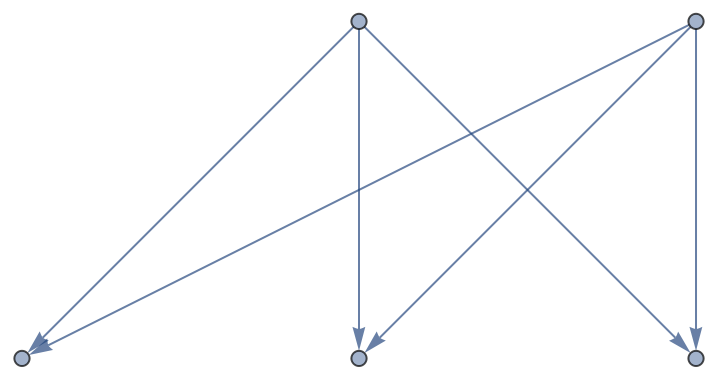
A directed graph:
In[]:=
Graph[{13,14,15,23,24,25}]
Out[]=
Auto–Visualization
Auto–Visualization
In[]:=
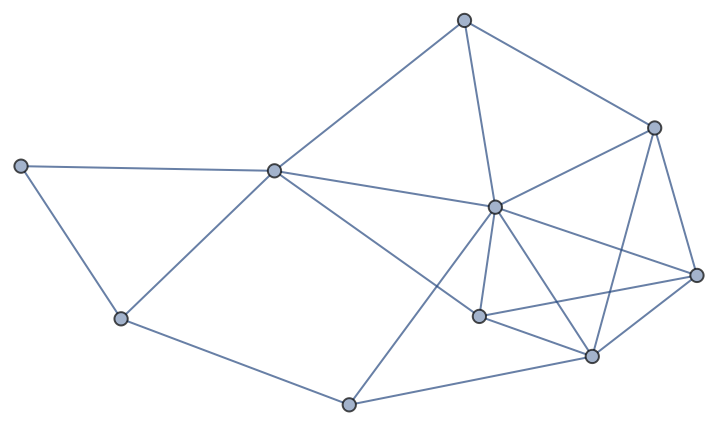
RandomGraph[{10,20}]
Out[]=
System options specify parameters relevant to the internal operation of the Wolfram System.
In[]:=
SystemOptions["GraphOptions"]
Out[]=
{GraphOptions{CacheResultsTrue,EdgeCountThreshold10000,RenderingOrderVertexFirst,VertexCountThreshold1000}}
In[]:=
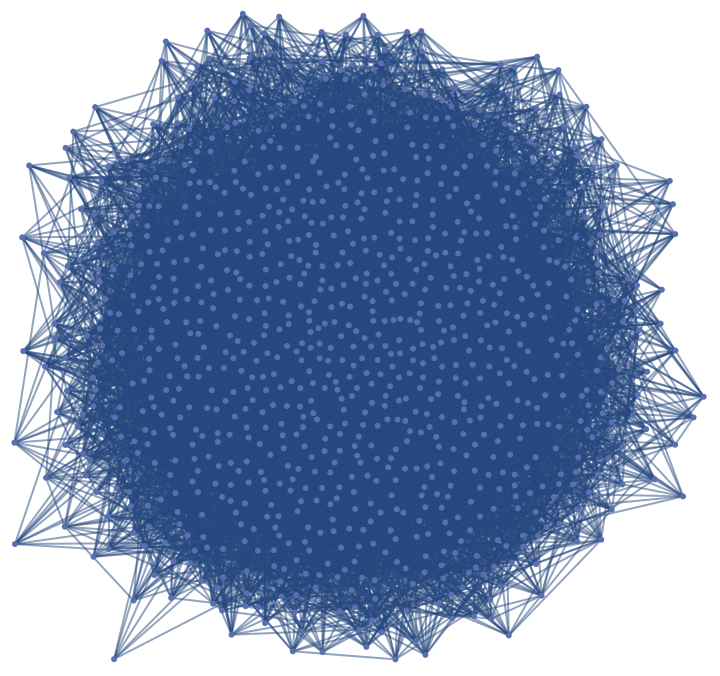
GraphPlot[RandomGraph[{1000,10000}]]
Out[]=
Internals of Graph objects
Internals of Graph objects
A graph object is treated as a raw object by functions like AtomQ and for purposes of pattern matching.
Use predicate function such as GraphQ, UndirectedGraphQ and DirectedGraphQ for pattern matching:
Use interface functions such as VertexList, EdgeList, Options to extract information:
Internals of Graph objects
Internals of Graph objects
Ordering of vertices and edges matter.
Equality:
Vertex and edge lists:
Adjacency matrix:
Check isomorphisms:
Matrix Representations
Matrix Representations
Build a graph from an adjacency matrix.
The adjacency matrix of a graph.
Internal Graph Representations
Internal Graph Representations
Efficient representations are used to store graphs.
Doubly-linked Lists: Efficiently add and remove elements
Sparse Matrices. Efficiently operate on elements
Types of Graphs
Types of Graphs
Undirected Graphs
Directed Graphs
Mixed Graphs
Multigraphs
Weighted Graphs
Weighted Graphs
Build a graph from a weighted adjacency matrix.
Set the default value for the weighted adjacency matrix to 0.
Edge Tagged Graphs
Edge Tagged Graphs
A tagged graph:
Graph Annotations
Graph Annotations
Full support of standard annotations (shape, labels, weights, style, ...) as well as user-defined annotations.
Standard annotations:
Special wrappers:
User-defined annotations:
Fundamentals of Graph Modeling
Fundamentals of Graph Modeling
Network Models
Network Models
Network Models from Data
Network Models from Data
Graph file formats: Graphlet, DOT, GraphML, GXL, DIMACS, LEDA, Pajek, …
Import the data and build the friend/foe social network emerging from Slashdot, a technology-related news website known for its specific user community.
Theoretical and Empirical Graphs & Networks
Theoretical and Empirical Graphs & Networks
Theoretical graphs — the Petersen graph:
Empirical graphs and networks — Florentine families network:
Random Graphs
Random Graphs
Random graphs following a variety of graph distributions allow one to build simulated networks.
Erdos-Renyi model:
Gilbert models:
Epidemiology studies of transmitted diseases:
Bridge Domains
Bridge Domains
Built-in Functions: AdjacencyGraph, IncidenceGraph, MorphologicalGraph, MeshConnectivityGraph, MoleculeGraph, …
3D boundary mesh connectivity graph:
Point to point:
Point to edge sharing the same face:
Graph Visualization
Graph Visualization
Interactive effects can be attached to vertices and edges. This provides information drill-down for greater information visualization.
Interactive food webs:
Graph Layouts
Graph Layouts
Rich set of graph layouts and visualization functions.
GraphLayout . GraphPlot . GraphPlot3D . TreePlot . LayeredGraphPlot . CommunityGraphPlot . GraphEmbedding . HighlightGraph
Fundamentals of Graph Analysis
Fundamentals of Graph Analysis
Structural Properties
Structural Properties
Many algorithms and procedures require graphs with certain properties.
Basic properties:
Local structural properties:
Global structural properties:
Paths and Cycles
Paths and Cycles
Create a random maze.
Solve the maze and highlight the path.
Centrality Measures
Centrality Measures
The Medici family did not have greatest wealth or most seats in the legislature, yet it rose to power. Through marriages, the Medici family had a position of centrality in the social network, crucial for communication, brokering deals, etc.
Components and Connectivity
Components and Connectivity
Analyze the social network emerging from Slashdot, a technology-related news website known for its specific user community.
Import the data and build the friend/foe network.
Find the basic statistics.
Analyze the in-degree distribution.
Summary
Summary
◼
Getting Started with Graphs & Networks
◼
Fundamentals of Graph Modeling
◼
Graph & Information Visualization
◼
Fundamentals of Graph Analysis
Wolfram R&D Livestream
Wolfram R&D Livestream
Subscribe to your YouTube channel: youtube.com/@WolframRD for more livestreams and videos.
CITE THIS NOTEBOOK
CITE THIS NOTEBOOK
Wolfram R&D LIVE: Insider's View of Graphs & Networks
by Charles Pooh
Wolfram Community, STAFF PICKS, September 8, 2023
https://community.wolfram.com/groups/-/m/t/3009184
by Charles Pooh
Wolfram Community, STAFF PICKS, September 8, 2023
https://community.wolfram.com/groups/-/m/t/3009184