Valeriepieris circle
Valeriepieris circle
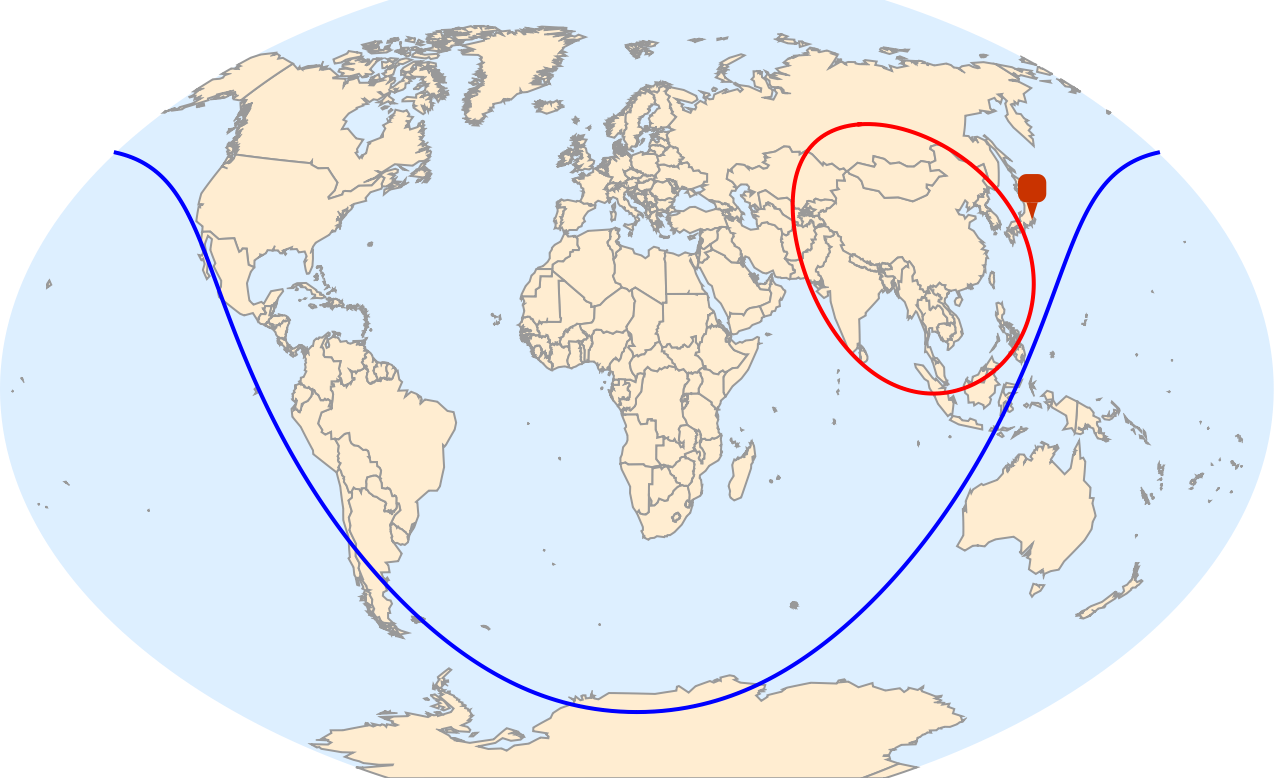
A Valeriepieris circle is a figure drawn on the Earth’s surface such that the majority of the human population lives within its interior. Here we will focus on the Valeriepieris circle encompassing 50% the human population. It’s location and radius were computed recently by Jari Kirma [1]. Here are the data for 50% and 99% circles:
In[]:=
pop50=GeoCircleGeoPosition[{29.296875`,100.1953125`}],;pop99=GeoCircleGeoPosition[{30.205078125`,16.46484375`}],;
The circles conform to the geographic projection specified and thus they do not look like perfect circles, but they are in terms of geo coordinates on the surface of Earth. Surprisingly, the 50% Valeriepieris circle does not contain Tokyo -- the top city by population:
In[]:=
GeoGraphics{Thick,Blue,pop99,Red,pop50},GeoMarker,GeoProjection->"WinkelTripel",GeoBackground->"CountryBorders"
Out[]=
100 most populous cities
100 most populous cities
Now we consider the data for the top most populous cities in the world [2, 3]:
data=;
They are given by an Association:
In[]:=
Short@data
Out[]//Short=
37732000,33756000,32226000,26940000,24973000,24922000,24073000,23086000,84,5983000,5954391,5952128,5871474,5849700,5827200,5818255,5768400
that can be tabulated as:
In[]:=
Out[]=
Cities falling withing the Valeriepieris circle
Cities falling withing the Valeriepieris circle
We can compute part of top 100 cities falling withing the Valeriepieris circle by two methods. First is using GeoWithinQ:
within1=Select[Keys[data],GeoWithinQ[GeoDisk@@pop50,#]&];
And second, much faster, using GeoNearest:
In[]:=
within2=GeoNearestKeys[data],GeoPosition[{29.296875`,100.1953125`}],All,
Out[]=
,,,,,,,,,,,,,,,,,,,,,,,,,,,,,,,,,,,,,,,,,,,,,,,,,,,,,,,,,,,,,,,,,,,,
We obtained identical sets
In[]:=
Sort@within1===Sort@within2
Out[]=
True
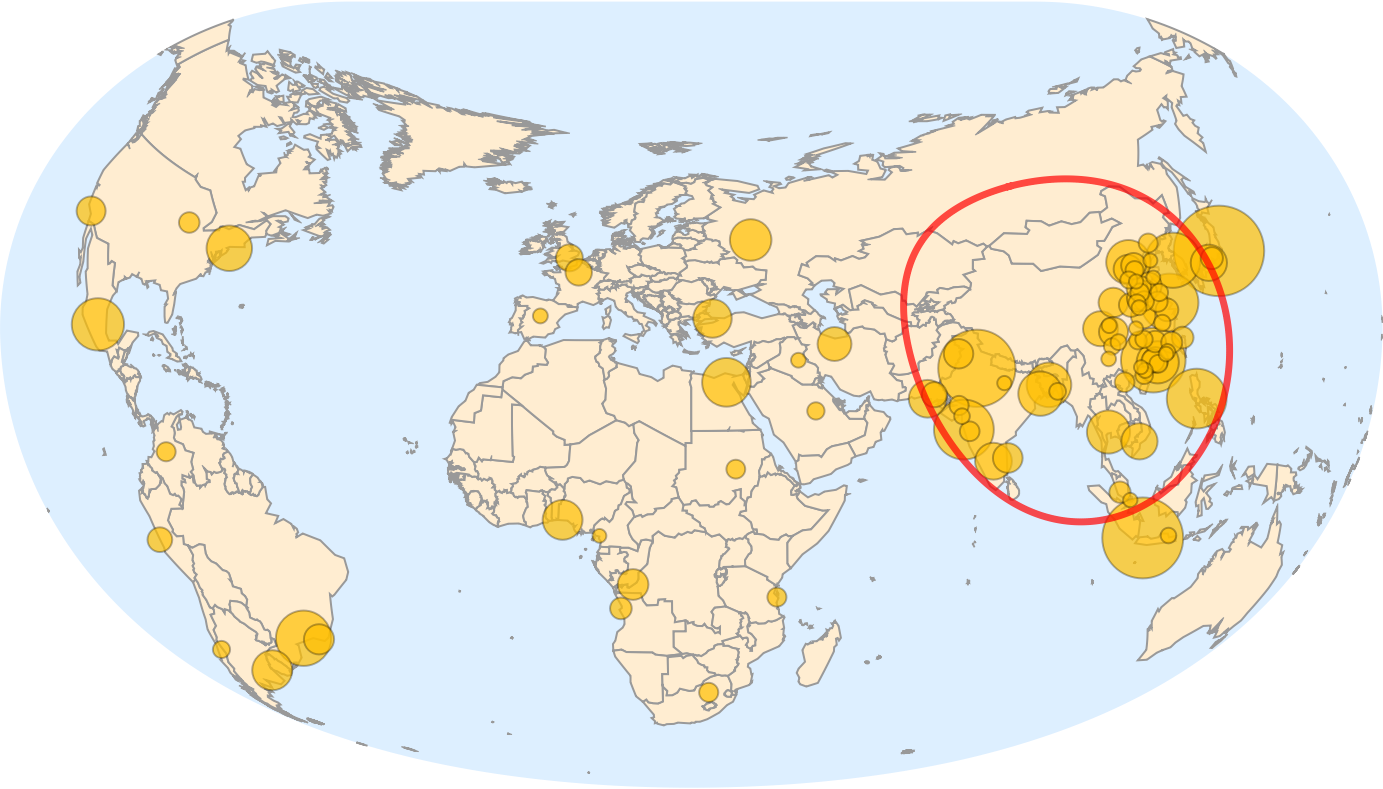
with total of 69 cities out of top 100 within the Valeriepieris circle
In[]:=
Length/@{within1,within2}
Out[]=
{69,69}
Visualization
Visualization
Finally we can place both: the top 100 cities and Valeriepieris circle on the map. I chose GeoProjection->”Armadillo” [4] as it represents well all pieces of data:
In[]:=
GeoBubbleChart[data,PerformanceGoal->"Speed",BubbleScale"Diameter",ImageSize->1000,GeoProjection->"Armadillo",GeoBackground->"CountryBorders",GeoCenter->GeoPosition[{50,25}],Epilog->{Thickness[.005],Opacity[.7],Red,pop50}]
Out[]=
Final visual: captions & styles:
Final visual: captions & styles:
Sources & references:
Sources & references:
◼
[1] Global population distribution: what’s a Valeriepieris circle, and where 99% of us live. URL: https://community.wolfram.com/groups/-/m/t/3024465
◼
[2] Demographia World, Urban Areas, 19th Annual: 202308. URL: http://www.demographia.com/db-worldua.pdf
◼
◼
CITE THIS NOTEBOOK
CITE THIS NOTEBOOK
Where half of the world lives: 69 of top 100 cities in Valeriepieris circle
by Vitaliy Kaurov
Wolfram Community, STAFF PICKS, March 17, 2024
https://community.wolfram.com/groups/-/m/t/3142243
by Vitaliy Kaurov
Wolfram Community, STAFF PICKS, March 17, 2024
https://community.wolfram.com/groups/-/m/t/3142243