B R A D V A R E Y --- O W N G O A L
Interval Analysis - Short Time Fourier
Interval Analysis - Short Time Fourier
Data
Data
Code
Code
In[]:=
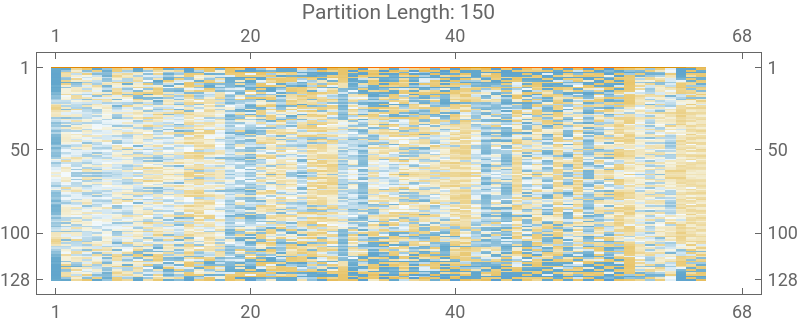
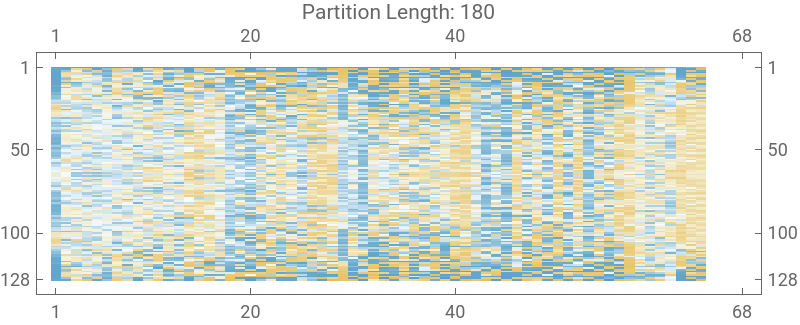
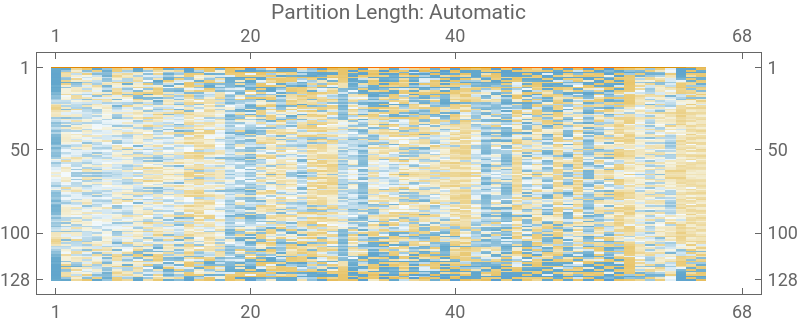
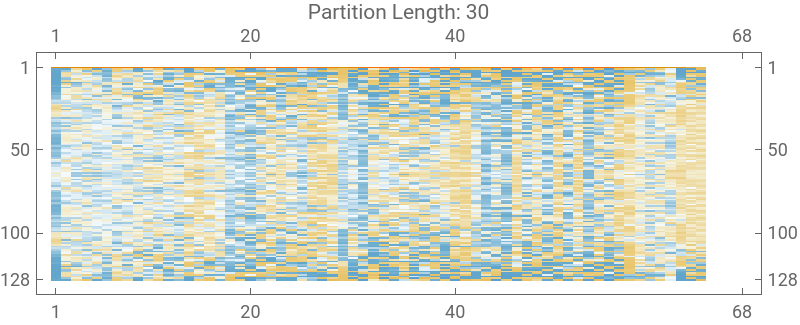
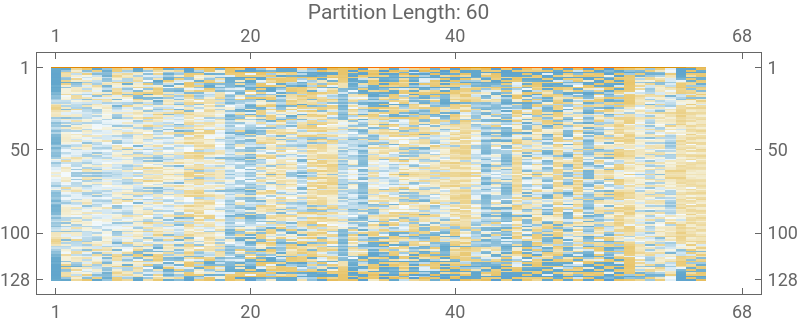
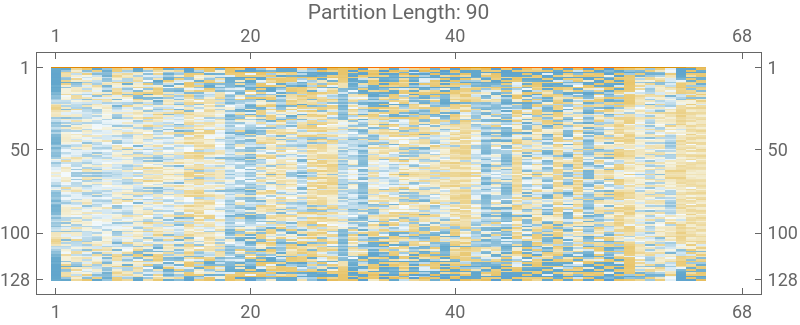
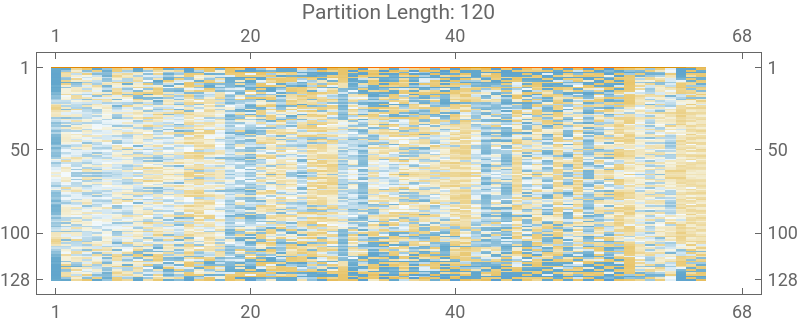
ClearAll[performAnalysis];performAnalysis[partitionLength_]:=Block[{stf,plotOptions,plotLabel},plotLabel="Partition Length: "<>ToString[partitionLength];plotOptions={ImageSize400,AspectRatio1/3,PlotLabelplotLabel};stf=ShortTimeFourier[pwrs,partitionLength,Automatic,HannWindow];MatrixPlot[Transpose[SpectrogramArray[pwrs]],plotOptions]]
Run
Run
In[]:=
partitionLengths={Automatic,30,60,90,120,150,180};ListLinePlot[pwrs]performAnalysis[#]&/@partitionLengths
Out[]=
Out[]=
,
,
,
,
,
,