While searching for information on vertical axis wind turbines, I came across the fascinating Squall Tower project in Dubai. This innovative building is just one example of a larger trend called “parametric design architecture”. Although the term “parametric” takes on a different meaning in this context, I became intrigued and decided to explore how to create similar structures using Parametric3D in the Wolfram Language.
The central tower of the project is surrounded by three towers that form the blades of a vertical wind turbine. Each tower comprises a cross-sectional profile that, with increasing height, rotates both around the central tower and its own center, creating the angle of attack necessary to generate a wind turbine effect.
This is the function squallProfilePoints for a number of coordinates along the cross section of the towers:
In[]:=
linePoints[{ptA:{xa_,ya_},ptB:{xb_,yb_}},m_]:=Transpose[{Subdivide[xa,xb,m],Subdivide[ya,yb,m]}]squallProfilePoints[r_,s_,d_,n_]:=Module[{crc1,crc2,γ,O1,O2,Q1,Q2,T1,T2,pts1,pts2,pts3,pts4},O1={0,0};O2={d,0};γ=ArcCos[(r-s)/(O2〚1〛-O1〚1〛)];T1=O1+r{Cos[γ],Sin[γ]};T2=O1+r{Cos[γ],-Sin[γ]};Q1=O2+s{Cos[γ],Sin[γ]};Q2=O2+s{Cos[γ],-Sin[γ]};pts1=DeleteCases[CirclePoints[r,n],_?(First[#]>=T1[[1]]&)];pts2=DeleteCases[CirclePoints[{d,0},s,Round[ns/r]],_?(First[#]<=Q1[[1]]&)];(*nrpointsonlinesegments*)m=Round[n*EuclideanDistance[T1,Q1]/2/Pi/r];pts3=linePoints[{pts1[[2]],pts2[[-1]]},m];pts4=linePoints[{pts1[[-1]],pts2[[1]]},m];Join[Rest@pts1,(*Most@*)pts4,pts2,Reverse@pts3,{T1}][[;;-2]]]pts=squallProfilePoints[1.,.333,4.,50]/.{x_?NumericQ,y_}->{-x,y};
In[]:=
Graphics[Point@pts,Axes->True]
Out[]=
To use the squallProfilePoints function in a parametric plot, we need another function converting the point coordinates into a continuous function. First we get an IntepolatingFunction for the polar radius of the profile:
In[]:=
lst=DeleteDuplicates[{ArcTan@@#,EuclideanDistance[{.0,0},#]}&/@pts];squallRadius=Interpolation@lst;
In[]:=
Quiet@ParametricPlot[FromPolarCoordinates[{squallRadius[u],u}],{u,-Pi,Pi},PlotPoints->5]
Out[]=
To further analyse the squall towers complex, we need a look at the sketch from this website:
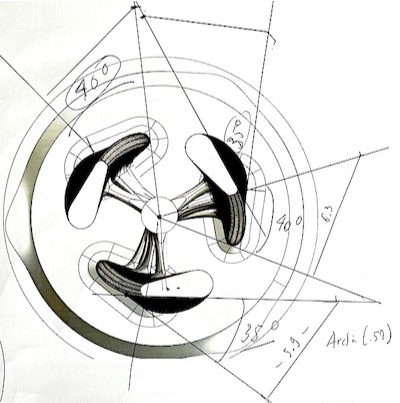
Upon examination of the sketch, we can see that during a 40-degree rotation of the tower around the center of the project (the origin), the tower profile rotates approximately 35 degrees around its center. By comparing the cross-sectional and side-view sketches, we can estimate the height of the towers. The width of the profile is about one-eighth of the tower’s height. This gives an increase of 0.22 degrees per unit height for the tower rotation and of 0.019 degrees per unit height for the profile’s rotation around its center. This corresponds to the towers forming wind turbine blades with an angle of attack of approximately 5 degrees.
The function squallTowerPoint generates the parametric coordinates of a point on the tower surface:
In[]:=
squallTowerPoint[u_,v_,dPhi_,dTheta_,cntr_,θ_]:=RotationTransform[dThetav+θ,{0,0,1},{0,0,0}][RotationTransform[dPhiv,{0,0,1},cntr][Flatten@{FromPolarCoordinates[{squallRadius[u],u}],v}+cntr]]
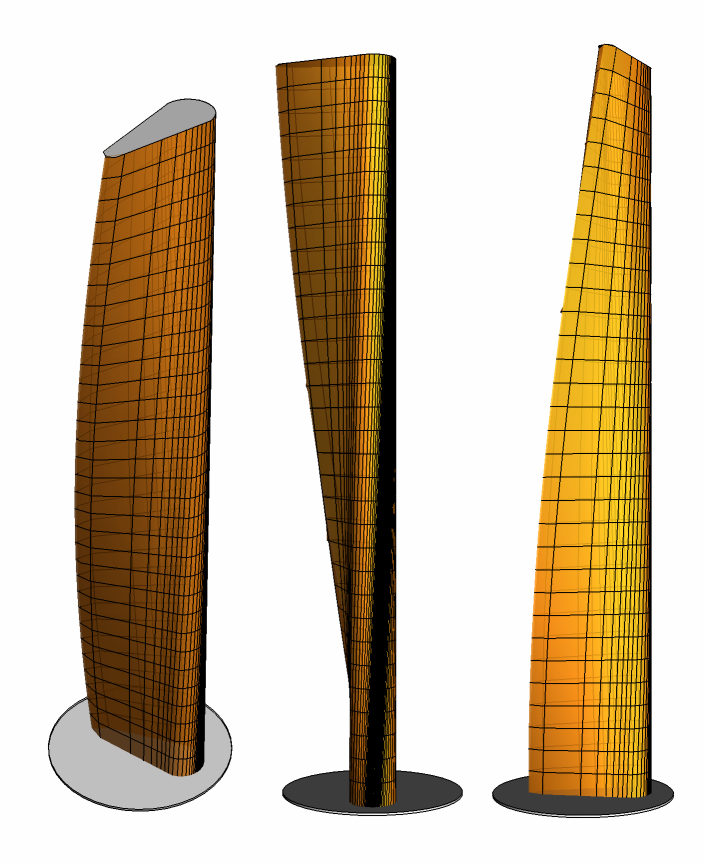
Here are 3 views of a single tower:
In[]:=
Module[{dPhi=.019,dTheta=.022,cntr={0,0,0}},Quiet@GraphicsRow@Table[Show[{Graphics3D@{Cylinder[{{-2,0,-.1},{-2,0,0}},4]},ParametricPlot3D[squallTowerPoint[u,v,dPhi,dTheta,cntr,0],{u,-Pi,Pi},{v,0,32},PlotStyle->Opacity[.85],Mesh->{ArcTan@@@squallProfilePoints[1.,.333,4.,32],Range[0,32]},MeshStyle->AbsoluteThickness[.5],PerformanceGoal->"Speed",Axes->False],Graphics3D[{EdgeForm[Black],FaceForm[LightGray],(*roof*)Polygon[squallTowerPoint[#,5.33*6,dPhi,dTheta,cntr,0]&/@Range[-3.14,3.14,.01]]}]},Lighting->"Accent",Boxed->False,ViewPoint->vwp],{vwp,{{1.3,-2.4,2},Right,Front}}]]
Out[]=
This is an animation of the complete rotating “Towering Turbine”!
In[]:=
Quiet@Module[{dPhi=.019,dTheta=.022,cntr={0,-5,0}},frames=ParallelTable[Graphics3D[Rotate[{(*base*)Cylinder[{{0,0,-.5},{0,0,0}},9],Table[{(*towers*)ParametricPlot3D[squallTowerPoint[u,v,dPhi,dTheta,cntr,t],{u,-3.1,3.1},{v,0,5.33*6},PlotStyle->Opacity[.75],Mesh->{ArcTan@@@squallProfilePoints[1.,.333,4.,5.33*6],Range[0,5.33*6]},MeshStyle->AbsoluteThickness[.5],PerformanceGoal->"Speed",Axes->False,Lighting->"Accent"][[1]],(*roof*){EdgeForm[Black],FaceForm[LightGray],Polygon[squallTowerPoint[#,5.33*6,dPhi,dTheta,cntr,t]&/@Range[-3.12,3.12,.01]]}},{t,{0,2Pi/3,4Pi/3}}]},ϕ,{0,0,1}],Lighting->"Accent",Boxed->False,PlotRange->{{-9.5,9.5},{-9.5,9.5},{-1,5.33*6}}],{ϕ,-3.12,3.12,3.12/25}]];
SetDirectory[NotebookDirectory[]]
In[]:=
Export["Parametric towers.gif",frames]
Out[]=
Parametric towers.gif