This project explores patterns in the facades of buildings in urban environments using image clustering techniques, with the potential for further exploration into component segmentation. The aim is to identify common facade types and investigate their distribution across different neighborhoods and time periods. The insights gained from this project will contribute to the field of Circular Architecture by providing a better understanding of the existing built environment. By identifying common facade types and their distribution, we can start to view the built environment as a resource bank, where building elements such as windows, doors, panels, etc., can be reused or recycled, thus promoting a more sustainable and circular approach to urban planning and architectural design.
Context and Background
Context and Background
Circular architecture is an innovative design philosophy that emphasizes the efficient use of resources. It promotes the reuse and recycling of building components, not just materials, to reduce waste and environmental impact. This approach is increasingly important as urban environments continue to grow and evolve, and the demand for sustainable and efficient practices in architecture and urban planning becomes more pressing.
The need for circular architecture is clear. The construction industry is one of the largest consumers of raw materials worldwide and is responsible for significant carbon emissions. By reusing and recycling building components, we can significantly reduce the demand for new materials and the energy required to produce them, leading to a more sustainable and efficient built environment.
Current attempts in circular architecture are still in their early stages, with a focus on mapping out the existing building resources in a city. This involves identifying and cataloging the various components of buildings, such as windows, doors, and facade panels, that could potentially be reused or recycled. Several initiatives are making strides in this area. For instance, the Circularity Hub offers a comprehensive view of the built environment based on data from the ‘Mapping the data’ focus area, and the Cities Knowledge Graph project is developing an innovative digital platform to combine data and share knowledge about cities.
Inspired by these initiatives and the work of Juchareal, a building elements recycling center based in Zurich, this project aims to analyze the built environment in terms of building components. By identifying common facade types and their distribution, we can start to view the built environment as a resource bank, where building elements can be reused or recycled.
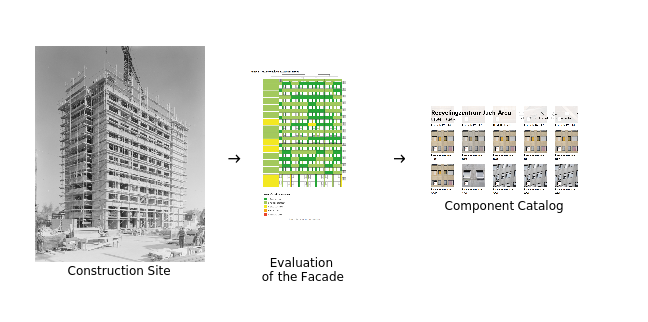
The Wolfram Language and Mathematica provide powerful tools for this task. They allow us to process and analyze large amounts of data, and their image processing capabilities are particularly useful for analyzing facade images. This project utilizes these tools to explore patterns in the facades of buildings and identify common facade types, thereby contributing to the ongoing efforts to promote circular architecture.
Methodology
Methodology
Data Collection
Data Collection
The project utilized the CMP facade database, which contains 606 rectified images of facades that have been manually annotated into 12 classes: “background”,”balcony”,”blind”,”cornice”,”deco”,”door”,”facade”,”molding”,”pillar”,”shop”,”sill”,”window”.
Color code for facade segmentation
In[]:=
componentRules=Association[{->"background",->"facade",->"molding",->"cornice",->"pillar",->"window",->"door",->"sill",->"blind",->"balcony",->"shop",->"deco"}];

◼
file import
Download data from
In[]:=
filePathBase=FileNameJoin[{$HomeDirectory,"Downloads","CMP_facade_DB_base","base"}];filePathEx=FileNameJoin[{$HomeDirectory,"Downloads","CMP_facade_DB_extended","extended"}];baseOriginal=Import/@FileNames["*.jpg",filePathBase];baseColor=Import/@FileNames["*.png",filePathBase];exOriginal=Import/@FileNames["*.jpg",filePathEx];exColor=Import/@FileNames["*.png",filePathEx];oImages=Join[baseOriginal,exOriginal];cImages=Join[baseColor,exColor];sOImages=ImageResize[#,Small]&/@oImages;sCImages=ImageResize[#,Small]&/@cImages;
◼
data sample
In[]:=
{sOImages[[1]],sCImages[[1]]}
Out[]=
,
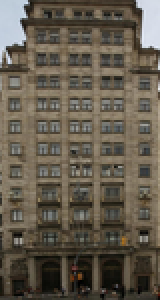
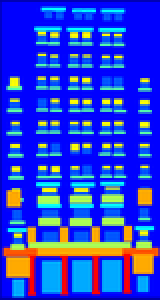
Image Processing
Image Processing
Each building was encoded into a 12-dimension vector, representing the components of the particular building. This encoding process transformed the image data into a format that could be processed by machine learning algorithms.
Define function for image processing
ClearAll[processImages];processImages[original_,colorCoded_]:=Module[{boundingBoxes,colorReplacedImages,measurements,rectangles},(*ReplacespecifiedcolorsinthecolorCodedimage*)colorReplacedImages=KeyValueMap[ColorReplace[colorCoded,{#1->White,_->Black}]&,componentRules];(*Measurecomponentsintheimage*)measurements=Map[ComponentMeasurements[#,"BoundingBox"]&,colorReplacedImages];(*Convertmeasurementstorectangles*)rectangles=Map[Values/*Apply[Rectangle],measurements];(*CreateboundingBoxesbythreadingovercomponentRules*)boundingBoxes=Thread[rectangles->Values[componentRules]];(*Returntheoriginalimageandtheboundingboxes*)original->Flatten[boundingBoxes]]
Extract components for each building
In[]:=
proResult=MapThread[processImages,{sOImages,sCImages}];
In[]:=
resultAssociation=Map[Association,proResult];
In[]:=
componentCounts=resultAssociation//Map[Query[All,GroupBy[Values],Length]]//Merge[Identity];
In[]:=
sampleResult
Out[]=
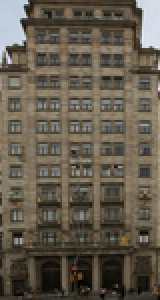
{background59,facade29,molding25,cornice7,pillar6,window127,door131,sill52,blind73,balcony59,shop10,deco30}
Feature Extraction using Building Components
Feature Extraction using Building Components
In[]:=
componentList=Values[componentRules]//Sort;reusableComponents={"balcony","door","facade","pillar","window"};
In[]:=
ClearAll[lookupValues];lookupValues[image_]:=Lookup[componentCounts,image]//Lookup[#,componentList,0]&;
In[]:=
ClearAll[lookupReusableValues];lookupReusableValues[image_]:=Lookup[componentCounts,image]//Lookup[#,reusableComponents,0]&;
Distance Calculation based on Building Components
Distance Calculation based on Building Components
A distance function was defined to calculate the similarity distance between two images. This function was based on the Euclidean distance between the 12-dimensional vectors representing the buildings. The distance function allowed for the creation of a nearest neighbor graph of similar buildings, providing a visual representation of the similarities and differences between the buildings.
In[]:=
defaultAssociation=AssociationThread[Values[componentRules]->0];
In[]:=
ClearAll[getDistance]getDistance[image1_,image2_]:=Module[{c1,c2,d1,d2,e1,e2},{c1,c2}=Lookup[componentCounts,#]&/@{image1,image2};{d1,d2}=Merge[Identity]@*(Append[#,defaultAssociation]&)/@{c1,c2};{e1,e2}=Map[First]/*KeySort/@{d1,d2}//Values;EuclideanDistance[e1,e2]//N]
Building Resource Graph
Building Resource Graph
In the building resource graph, each vertex represents a building, and the edges denote the similarity between buildings in terms of their component composition. This graph provides a visual and intuitive way to understand the distribution and similarity of building resources, aiding in strategic planning for the reuse and recycling of building components. Buildings with similar components can potentially share renovation or recycling strategies, making this graph a valuable tool for identifying clusters of similar buildings. Furthermore, the graph serves as a basis for further analysis, such as identifying patterns and trends in the use of building components, understanding the distribution of different types of building components across the city, and predicting the potential for component reuse in future building projects.
Custom vertex labels using building image
Define vertex shape function
Building resource graph
Community Graph
Community Graph
Building upon the building resource graph, the community graph offers a more aggregated view of the distribution and utilization of building components. Each community in the graph, annotated with component statistics, represents a cluster of buildings with similar component compositions.
Find community in the graph
Statistics on reusable components in each community
Create community graph plot
Exploratory Search Functions
Exploratory Search Functions
Component-Based Building Search
Component-Based Building Search
The component-based building search function allows users to input a specific building component, such as a window, door, or facade panel, and returns the buildings that contain the most of this component. By providing a targeted way to identify buildings rich in specific resources, this function can help architects, urban planners, and other stakeholders make informed decisions about where to focus their reuse and recycling efforts.
Image-Based Similarity Search
Image-Based Similarity Search
This feature allows users to input a building image and retrieve the most similar buildings based on their component composition.
Appendix
Appendix
Manipulation for component search
Manipulation for nearest image search
Concluding remarks
Concluding remarks
This project developed a tool for identifying buildings with similar component compositions, thereby creating a resource graph that can be instrumental in circular architecture. By clustering similar buildings, we have provided a platform that can inspire architects and urban planners with renovation or recycling strategies that have been proven effective in one building and can potentially be applied to others within the same cluster. This approach is exemplified by the project in Zurich, where the strategic reuse of facade components significantly contributed to the renovation process.
Looking ahead, there are several areas for future work and improvement:
1. Automated Labeling and Feature Extraction: The labeling of data is a crucial step in this workflow. We attempted to train a neural network to automatically label building images from Google Street View, but the results were not satisfactory. Future efforts will explore other network models to improve the automation of the labeling process and feature extraction.
2. Expanding the Dataset: The CMP building dataset used in this project, while valuable, has its limitations. The images are all rectified and predominantly depict European countries. To broaden the scope and applicability of our tool, future work will include street images from various angles and incorporate high-density cityscapes from diverse global regions.
3. Enhanced Vector Representation: Currently, our methodology uses component counts as the vector representation of buildings. However, the position and relation between components are also essential in understanding buildings. Therefore, future steps will include considering the syntax and semantics of facade segmentation for a more comprehensive and nuanced analysis of buildings.
In conclusion, this project has laid a foundation for the application of data-driven methods in the promotion of circular architecture. By continuing to refine and expand upon these methods, we can contribute to a more sustainable and resource-efficient approach to urban planning and architectural design.
Keywords
Keywords
◼
Circular Architecture
◼
Component Segmentation
◼
Image Clustering
◼
Graph Analysis
Acknowledgment
Acknowledgment
I would like to express my deepest appreciation to my mentor, Faizon Zaman, for his invaluable guidance and support throughout this project. His expertise and insights have been instrumental in shaping this work. I am also grateful to Maria Sargsyan for her assistance and for sharing her knowledge. Last but not least, my heartfelt thanks to everyone at the Wolfram Summer School for creating such a stimulating and supportive learning environment.
References
References
◼
Juchareal, building elements recycling center based in Zurich. (2023). https://juchareal.store/
◼
Circularity Hub. (2023). https://www.circuit-project.eu/circularity-hub
◼
Future Cities Laboratory. (2023). Cities Knowledge Graph. https://fcl.ethz.ch/research/research-projects/cities-knowledge-graph.html
◼
Tyleček, R., & Šára, R. (2013). CMP Facade Database. http://cmp.felk.cvut.cz/~tylecr1/facade/
CITE THIS NOTEBOOK
CITE THIS NOTEBOOK
Exploring facade patterns in urban built environments: a step towards circular architecture
by Bing Yang
Wolfram Community, STAFF PICKS, July 13, 2023
https://community.wolfram.com/groups/-/m/t/2959033
by Bing Yang
Wolfram Community, STAFF PICKS, July 13, 2023
https://community.wolfram.com/groups/-/m/t/2959033