This essay details my journey with Wolfram Research, from applying to the Wolfram Summer Camp to interning at Wolfram. Check out my:
COVID-19 Data Analysis and Visualization Course
Analyzing COVID-19 Study Group
Wolfram Summer Camp Project
COVID-19 Data Analysis and Visualization Course
Analyzing COVID-19 Study Group
Wolfram Summer Camp Project
Starting Out
Starting Out
Before the Wolfram Summer Camp, all I knew about Wolfram Research was Wolfram Alpha. I used it all the time for integrals, and it was almost magical.

In my search for summer opportunities in 2019, I stumbled upon the Wolfram Summer Camp. “Wow, the guys who made Wolfram Alpha!” I thought to myself. I ended up applying, not thinking much of it. Looking at the alumni of the program, with projects so innovative I didn’t think they would be possible, was pretty intimidating to say the least.
I ended up getting an interview, and I don't think I've ever been more nervous for one. I barely knew any Wolfram Language, and my only experience in coding was through my computer science class at school, which only covered Java. Java, as many of you already know, is a wildly different language. While Java is an object oriented language, Wolfram was a functional language. This, in many instances, makes for a much better language, but I was just not familiar with that type of thinking!
The interview went okay, although I did come off as knowing just about zero Wolfram Language (which was true). Due to that, I basically gave up, thinking I won't be accepted.
On a casual day, I was going to get food with my friend after school. I hopped into his car and he started driving. Casually pulling out my phone, I read "Wolfram Summer Camp (WSC) Decision." I open the email, not expecting much. The first word read "Congratulations!" "Wow, what a rude way to start a rejection letter," I thought.
Realizing I was accepted, I burst with joy. My friend was quick to react similarly. Thankfully, he was also quick to react to the fact that he had almost swerved off the road!
The Camp
The Camp
Soon, I set foot in Boston. I travelled by bus, and once I got to the Boston station, got an Uber to the location of the camp. Someone hopped in my Uber, and they were dropped off at the same location for some reason. They looked a little too old to be a high schooler, so I had no clue who they could be. Spoiler alert: that person turned out to be my research mentor!
Anyways, I went in to my dorm. I met my two roommates that night, Khang and Nico. Khang was a geometry whiz, participating in international geometry olympiads and writing an advanced geometry book, and Nico was already a published researcher, doing work on mathematical topics I can barely pronounce. What's a p-adic etale cohomology anyways?
At the end of the first day, we gathered together as a camp for dinner. While eating some (very) delicious pizza, I heard a lot of gossip. I looked around, and I saw Stephen Wolfram enter the room! My friend and I went up to strike a conversation, and soon, the entire camp gathered around the entrance to talk with him. The conversation went from politics to AI to (inevitably) . From the first day, I knew this camp would be something special.
The next two weeks were one of the most productive of my life. From dozens of lectures on fascinating topics, to meeting some of the brightest people in my age group, to talking computational everything with my mentor, it was an extremely exciting time.
Out[]=
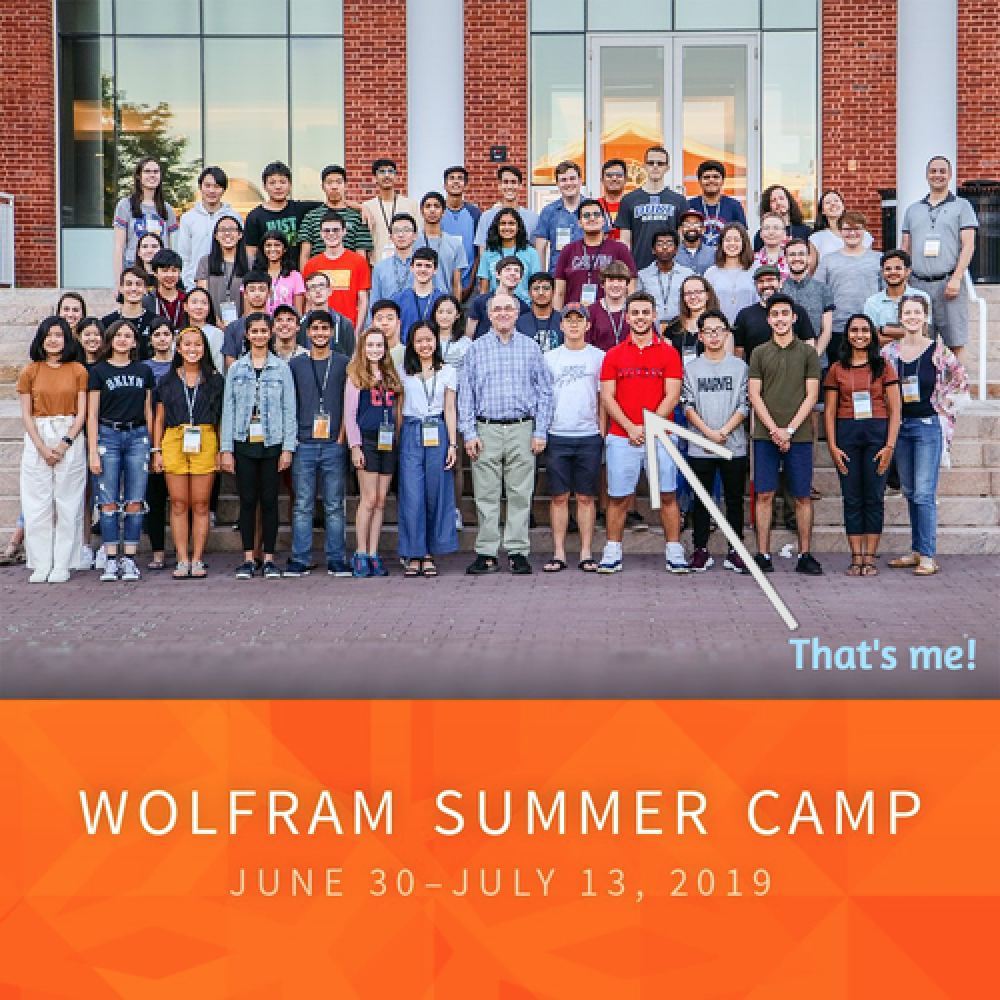
Over the course of these two weeks, I got to interact with Stephen Wolfram quite a lot, and it was extremely insightful, both intellectually and personally. Stephen had unique and revolutionary ideas, and had a unique life journey to match them. Perhaps the most important takeaway I had from this program and specifically interacting with Stephen Wolfram is to view the world through a new lens, through computation.
Out[]=

Continuing Involvement
Continuing Involvement
I continued being an active member of the Wolfram Community after my involvement with WSC. I participated in the inaugural Wolfram Emerging Leaders Program, participated in a year-long continuation of my WSC research with Jason Sonnenberg, a computational scientist at Wolfram, and became a Wolfram Ambassador. I began using Wolfram technologies in my school projects, my books, and so much more.
My Internship Experience
My Internship Experience
This brought me to using the Wolfram Language to look at COVID data. When the COVID-19 pandemic started, I took to my notebook, trying to look at it from a computational lens. I tried to determine the validity of various claims I’ve been hearing, and explore the data in general. After applying as an intern to Wolfram and finding out there’s talk of a COVID-19 Data Analysis and Visualization course, I was more than excited to take part!
By the second day in my internship, I was already planning the videos in the course. My manager M. Bahrami and I came up with a total of seven, each packing a lot of information to help make Wolfram Language beginners confident enough to analyze data on their own.
The first two videos were simply introductory guide videos to the Wolfram Data Repository and the COVID-19 resources page.
After that, the first technical video I made was regarding the epidemic dataset on the Wolfram Data Repository. This dataset is very large, and contains timeseries for confirmed and recovered cases as well as deaths in administrative divisions globally.
In[]:=
ResourceData["Epidemic Data for Novel Coronavirus COVID-19"]
Out[]=
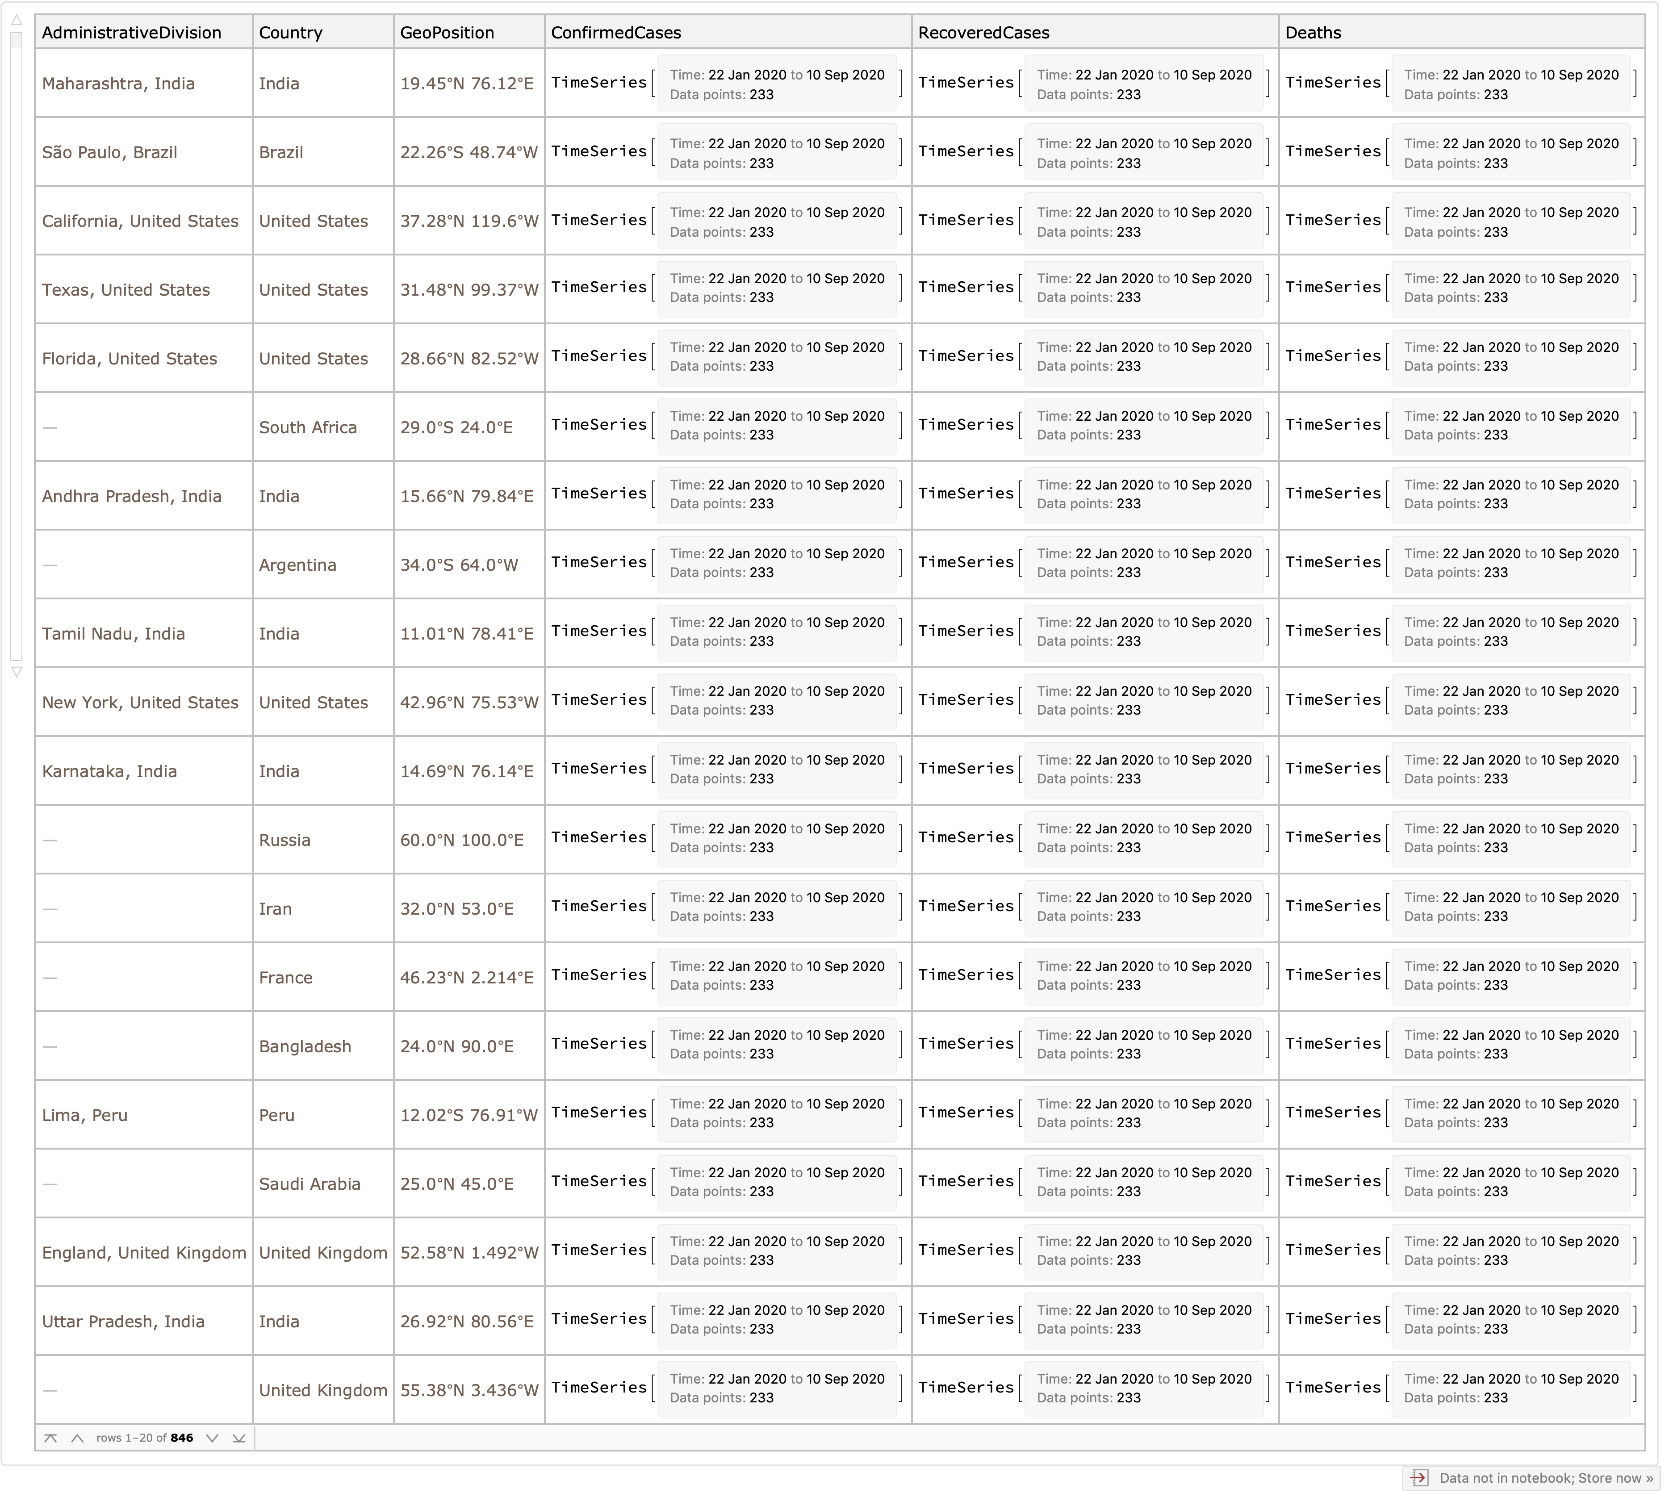
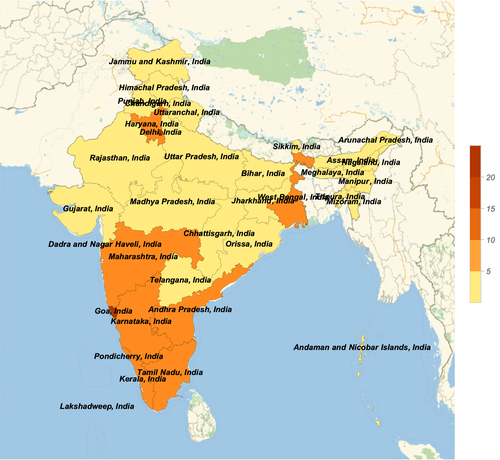
This was a wonderful dataset to analyze, as one can do a lot with it. Take for example this heat map of confirmed cases per square mile in India:
In[]:=
GeoRegionValuePlot[ResourceData["Epidemic Data for Novel Coronavirus COVID-19","IndiaProvinces"][All,#AdministrativeDivision#ConfirmedCases["LastValue"]/QuantityMagnitude[#AdministrativeDivision["Area"]]&],PlotRange{1,20},GeoLabelsTrue,LabelStyle{10,Italic},ImageSizeLarge]
Out[]=
The second technical video was very different, covering the genetic sequences of the SARS-Cov-2 virus.
In[]:=
ResourceData["Genetic Sequences for the SARS-CoV-2 Coronavirus"]
Out[]=
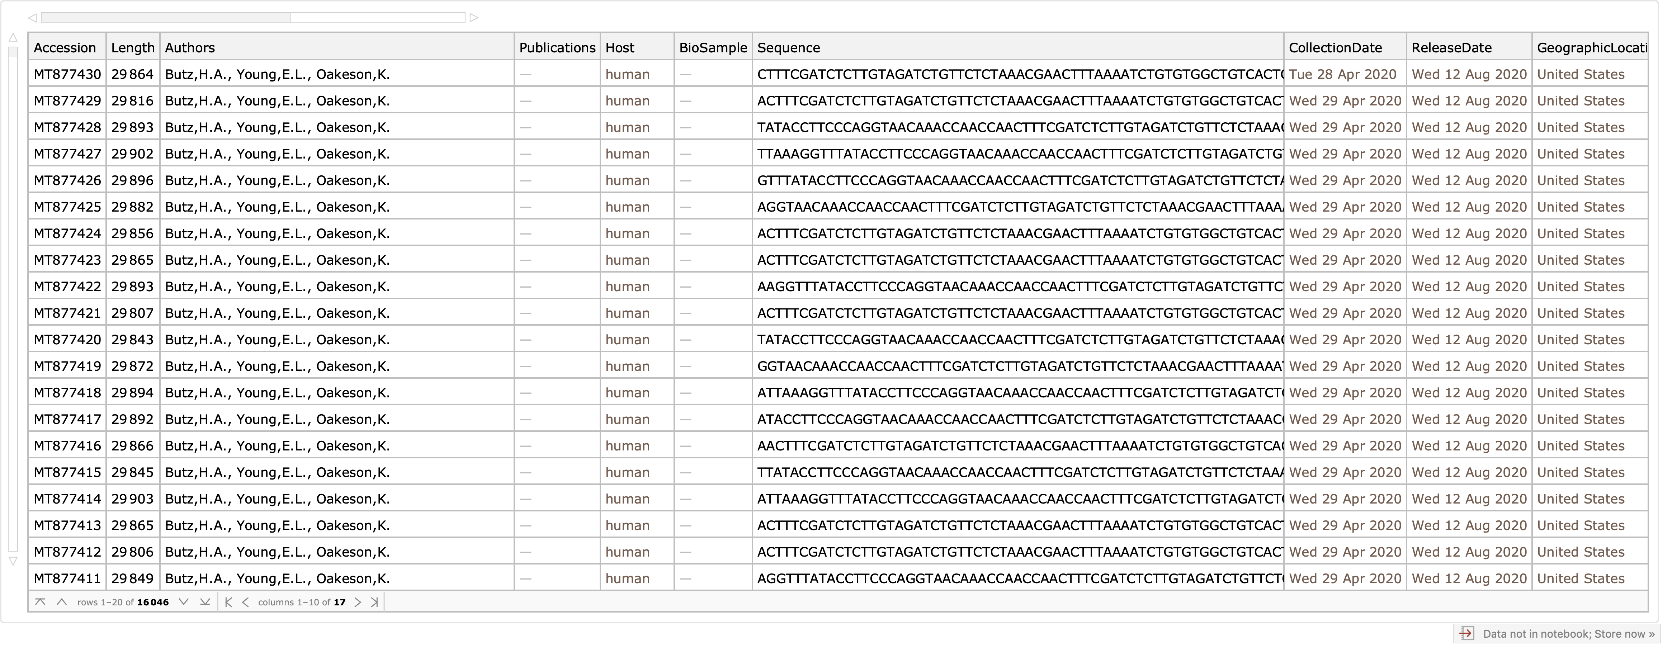
There was a whole lot to do with this data, especially looking at how the virus evolves geographically and historically. A neat snippet from that video was the following simple code that generates a phylogenetic tree:
The third video concerned the patient medical dataset, which was a huge dataset of patient medical data that includes everything from symptom data to timeline data.
It also included the travel history of some patients! By using the GeoGraphics function, we can generate a world map that shows people’s travel history.
Now, onto the hardest two videos to make: the mathematical modeling videos. These two videos cover the compartmental models that drive so many public health decisions. Compartmental models are simply models for the spread of infectious diseases that divide a population into many compartments, or health states, and write equations to model the transfer of people between compartments. The simplest is the SIR model, or the susceptible-infected-recovered model. Schematically, it can be shown through this simple diagram:
Here’s an example of what such a model would look like:
You can play a lot with this model by varying the parameters:
When I first started learning about these models, I thought very little of them. I didn’t realize the power such simple models hold. In trying to model South Korea’s COVID-19 data, the model was actually very successful. To demonstrate this, we first have to set up our data:
Now, we will have to set up the differential equations and solve for our variables:
What I did next is not required, but is very much a good step to take. We’ll try to plot the parametric functions to fit the parameters manually to our data. These parameter guesses will serve as our initial values for later optimization.
Now, onto fitting the model! After processing our data, we can simply use the NonlinearModelFIt function to get a fitted model, which we can plot.
Prepend 1 as a tag for infected data and 2 for recovered data, then join them:
Define a fitting function for the infected and recovered data separately, depending on their tags (1 and 2):
Fit nonlinear models solI and solR to infected and recovered data, respectively, at the same time:
Compare the fitted model to the data:
The experience of making this video course was truly wonderful, both in meeting so many cool people at Wolfram changing the world of computation and in learning so much about COVID-19 and data science. If you enjoyed this computational journey, I recommend you to take the video course that is now up on Wolfram U, and also register for the upcoming study group accompanying the course, which is beginning on Monday, September 28th!
I’d love any feedback on the videos, and any suggestions on things to cover in the study group. See you there!
I’d love any feedback on the videos, and any suggestions on things to cover in the study group. See you there!