Ponchon-Savarit Diagram for Methanol-Water Mixture
Ponchon-Savarit Diagram for Methanol-Water Mixture


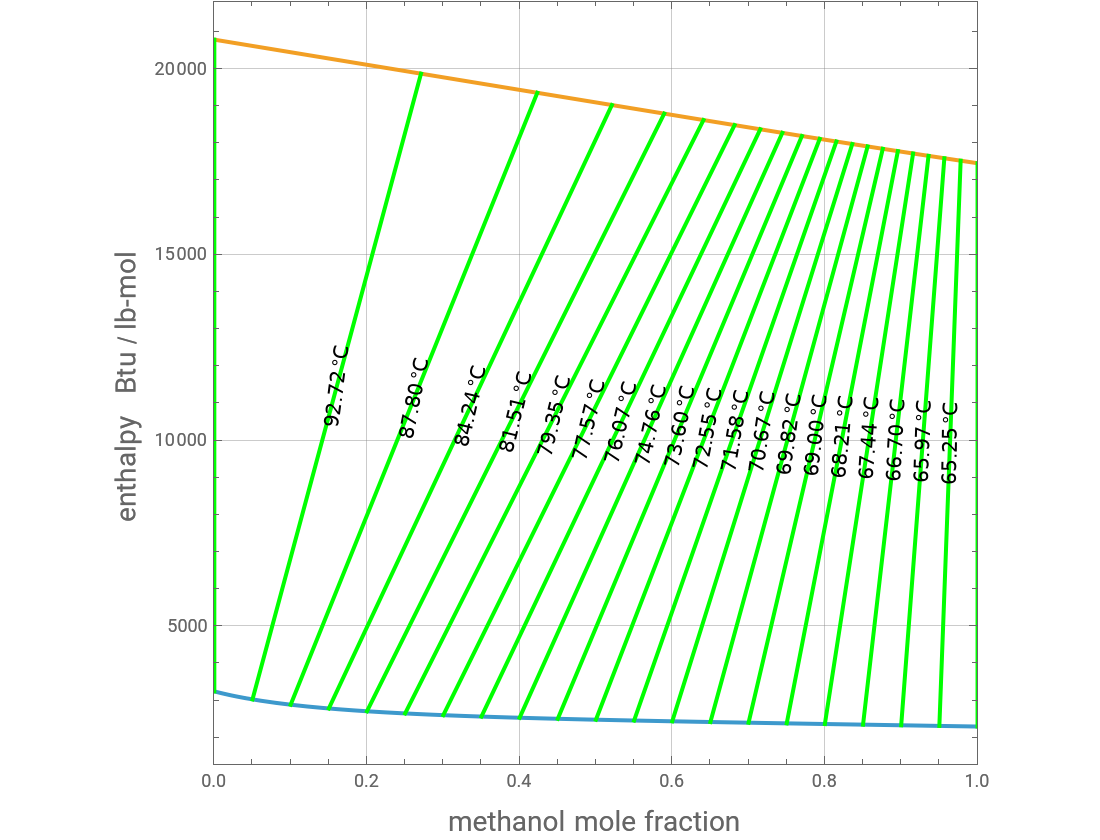
This Demonstration shows plots of the Ponchon–Savarit diagram (i.e., (y) and (x)) for a methanol-water mixture at user-set values of the total pressure, . In addition, the tie lines or isotherms are shown in green. The data obtained in our simulation, for , agrees very well with those given in Henley and Seader's classic textbook[1], which are shown by red dots. The vapor-liquid equilibrium data is also plotted in a separate diagram.
H
V
h
l
P
P=760mmHg
References
References
[1] E. J. Henley and J. D. Seader, Equilibrium-Stage Separation Operations in Chemical Engineering, New York: Wiley, 1981.
Expressions for pure component vapor and liquid enthalpies were adapted from Aspen-HYSYS. Enthalpies are above and are given in .
0°C
Btu/lb-mol
Permanent Citation
Permanent Citation
Housam Binous, Naim Faqir
"Ponchon-Savarit Diagram for Methanol-Water Mixture"
http://demonstrations.wolfram.com/PonchonSavaritDiagramForMethanolWaterMixture/
Wolfram Demonstrations Project
Published: May 11, 2012