COVID-19 — The Swedish Experiment
Jan Brugård, CEO Wolfram MathCore
May 15 - September 14, 2020
Jan Brugård, CEO Wolfram MathCore
May 15 - September 14, 2020
Is it working?
Is it working?
In this document I try to cover the spread of COVID-19 in Sweden and how it has correlated with statements and decisions from the Public Health Authority of Sweden. In doing so I have used publicly available data from their site as well as media (references given in the text).
So let me start by loading data for Sweden:
In[]:=
rawCovidData=ResourceData["Epidemic Data for Novel Coronavirus COVID-19"];confirmedCases=Normal[rawCovidData[GroupBy["Country"],Total,"ConfirmedCases"]];confirmedDeaths=Normal[rawCovidData[GroupBy["Country"],Total,"Deaths"]];confirmedCasesSweden=TimeSeriesWindow[confirmedCases[[Key[CountryData["Sweden"]]]],{{2020,1,30},{2021,1,28}}];confirmedDeathsSweden=TimeSeriesWindow[confirmedDeaths[[Key[CountryData["Sweden"]]]],{{2020,1,30},{2021,1,28}}];
The first known case of COVID-19 in Sweden was reported on January 31. The infected person had just returned from a trip to China. On February 5 the Swedish authorities announced that that people returning from trips in China should contact healthcare in case they showed any symptoms. On February 25 the authorities upgraded the risk of finding infected people in Sweden to high. One day later, on February 26, the second case was reported. This time it was a person returning to Gothenburg from Italy. The day after, five new cases were reported. Two of them had been found through tracing and had been infected by the second patient, one had been infected in Italy, one in Germany, and one in Iran. The latter was the first known case in Stockholm. This is how the initial period looked like:
In[]:=
DateListPlot[TimeSeriesWindow[confirmedCasesSweden,{{2020,1,30},{2020,3,2}}],ImageSizeLarge,PlotRangeAll,JoinedFalse,PlotLabel"Sweden Accumalted COVID-19 confirmed cases"]
Out[]=
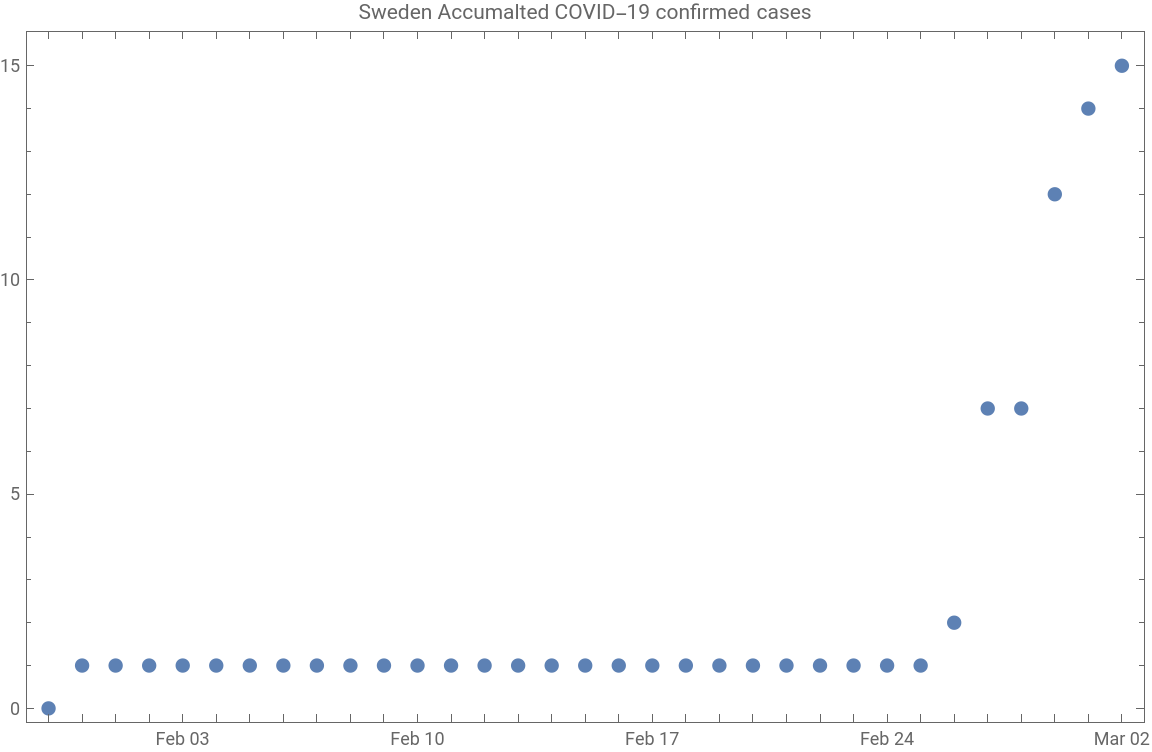
On March 2, the Public Health Authority of Sweden requests that IranAir's flights from Iran should be cancelled to prevent spread from Iran. The same day they announced that the risk of encountering new cases in Sweden is increased to very high. The day after they recommend testing of all returning people from northern Italy if they show any symptoms within 14 days, and on March 6, the Foreign Ministry of Sweden issues a recommendation to avoid travels to northern Italy. At the same time the number of reported cases start to increase:
In[]:=
DateListPlot[TimeSeriesWindow[confirmedCasesSweden,{{2020,3,2},{2020,3,9}}],ImageSizeLarge,PlotRangeAll,JoinedFalse,PlotLabel"Sweden Accumalted COVID-19 confirmed cases"]
Out[]=
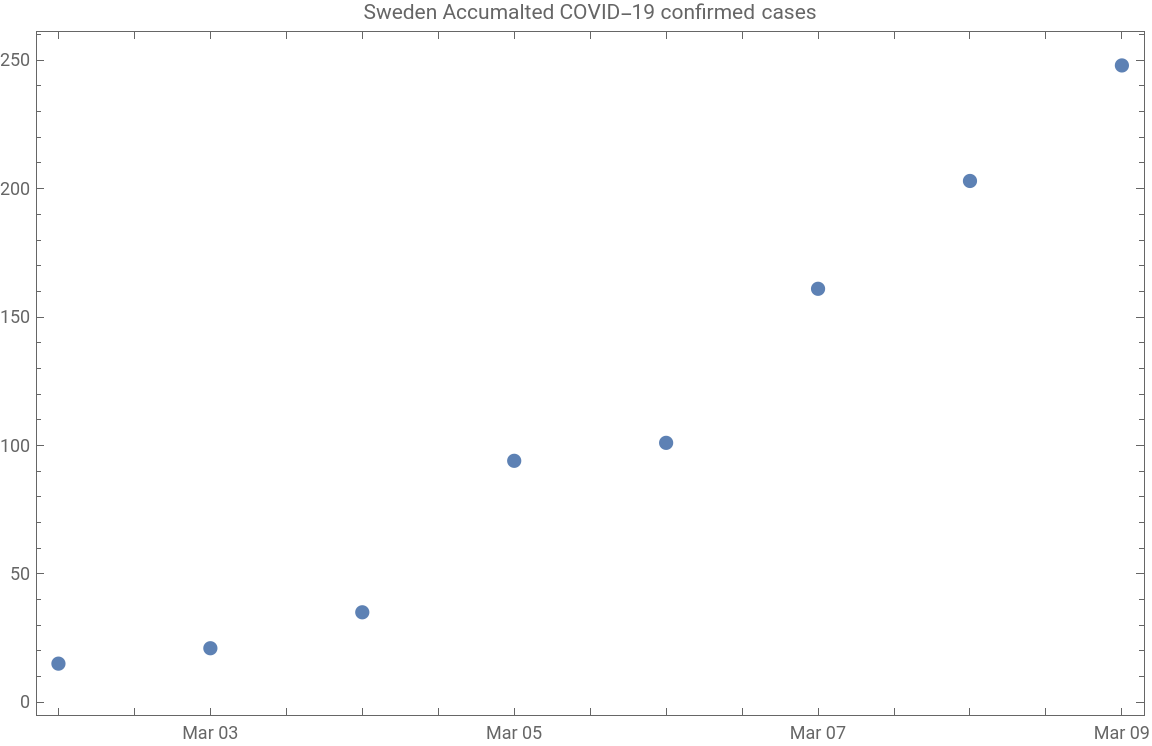
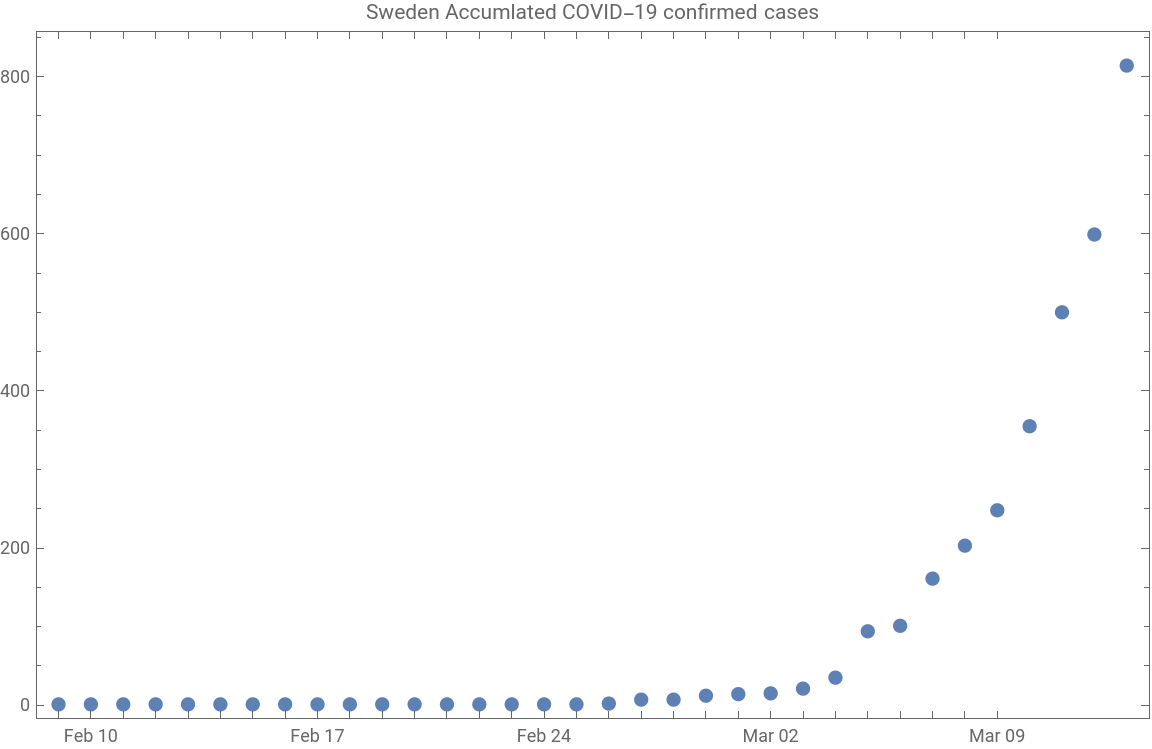
On March 9 a total of 250 people have been tested positive, and on March 10 the Public Health Authority states that they can now see a broader spread (sw: SAMHÄLLSSPRIDNING) in Sweden. They make it clear that anyone, especially the elderly, that show any symptoms should limit their social interaction. The day after, on March 11, a recommendation to limit public gatherings to a maximum of 500 people is issued. The same day the WHO declares Corona as a Pandemic. On March 13, they declare a new phase in the fight against the pandemic. The focus is on delaying the spread and protecting the elderly. The countries chief epidemiologist, Anders Tegnell, states:
– The important thing is that everyone takes their responsibility and stay at home when they are not healthy and for safety two day after one has become healthy and not shown any symptoms at all.
At this time a total of 800 had been tested positive:
In[]:=
DateListPlot[TimeSeriesWindow[confirmedCasesSweden,{{2020,2,9},{2020,3,13}}],ImageSizeLarge,PlotRangeAll,JoinedFalse,PlotLabel"Sweden Accumlated COVID-19 confirmed cases"]
Out[]=
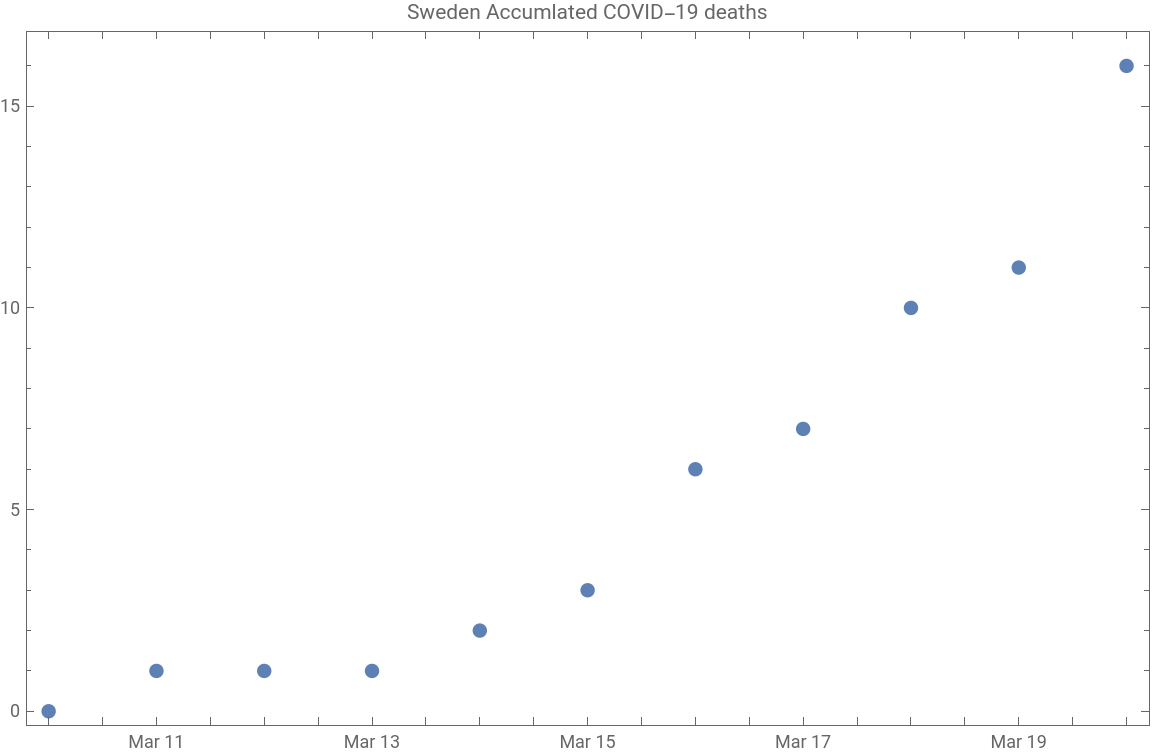
The first death in COVID-19 in Sweden was reported two days earlier, i.e. on March 11, and started to slowly grow from there:
In[]:=
DateListPlot[TimeSeriesWindow[confirmedDeathsSweden,{{2020,3,10},{2020,3,20}}],ImageSizeLarge,PlotRangeAll,JoinedFalse,PlotLabel"Sweden Accumlated COVID-19 deaths"]
Out[]=
March 16 persons over 70 years were recommended to restrict their social contacts as much as possible and a recommendation to work from home if possible was issued. On March 17 High Schools and Colleges are recommended to go over to remote teaching. The following days new recommendations are added, including travel recommendations (March 19), limitations for restaurants (March 24), and further restrictions on gatherings, limiting them to a maximum of 50 people (March 27). As you probably noted by now, the measures taken are mainly recommendations and almost no bans.
At this time media around the World had started to write about the Swedish experiment, as in these articles: (Financial Times, March 25), New York Times, Sweden goes against the current: full means of transport and open offices (Repubblica, March 26, in Italian), and the Swedish exception (El País, April 3, in Spanish).
During April, there were only minor adjustments to the recommendations. So how has the Swedish experiment worked this far?
In[]:=
Column[{DateListPlot[TimeSeriesWindow[confirmedCasesSweden,{{2020,1,31},{2020,5,10}}],ImageSizeLarge,PlotRangeAll,JoinedFalse,PlotLabel"Sweden Accumlated COVID-19 confirmed cases"],DateListPlot[TimeSeriesWindow[confirmedDeathsSweden,{{2020,1,31},{2020,5,10}}],ImageSizeLarge,PlotRangeAll,JoinedFalse,PlotLabel"Sweden Accumlated COVID-19 deaths"]}]
Out[]=
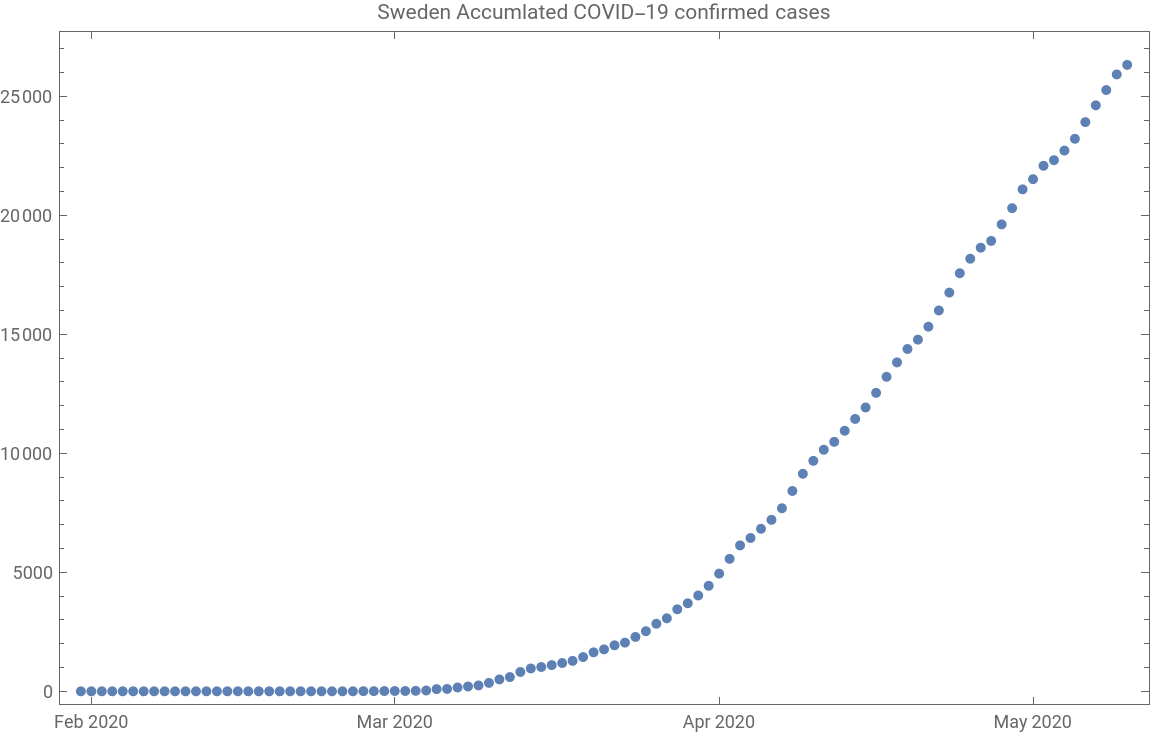
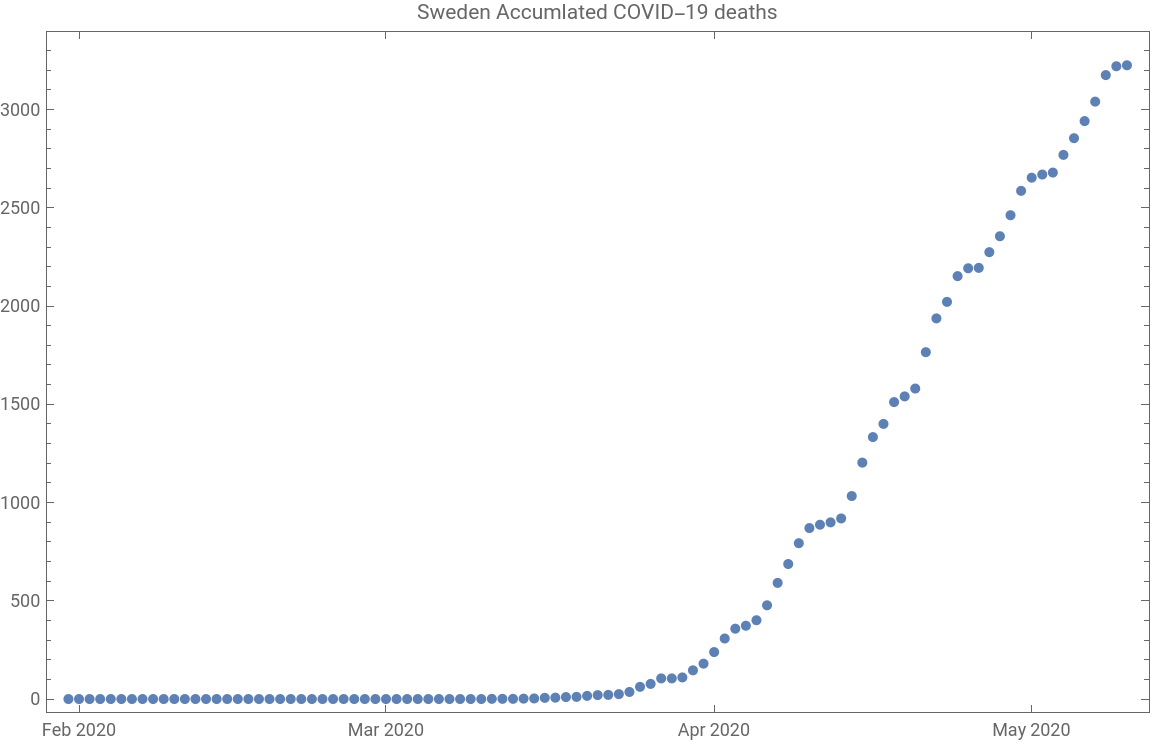
The periodic trend that is seen (the step-like behavior in deaths) is explained by under reporting during weekends and holidays. There are more than 3,000 fatalities as of this writing, which is among the highest reported rates per capita in the World. If we count per known case the rate is also very high:
That is, there’s a case fatality rate of more than 10%, so it looks like Sweden is not doing that well. But is that the whole truth?
The NY Times has a continuously updated in which they compare the excess deaths and official COVID-19 numbers for several countries, including Sweden. If there is a big difference between these, then it is likely some problem in the COVID-19 reporting. For instance, Ecuador (where I grew up) had reported 1,561 COVID-19 fatalities during March - April. However, they have 10,100 fatalities more than normal during this same period. In contrast Sweden reported 2,996 COVID-19 deaths during March 16 - May 3, compared to 3,300 excess deaths. In other words, the reliability of reported numbers seems to vary a lot from one country to another. This is the full table from NY Times:
So let us look a a bit more at the data from Sweden again. On May 11, Statistics Sweden reported that the excess deaths in Sweden were going down (but with variations though out the country). This trend is more easy to spot in a logarithmic plot.
However, let us compare the numbers with the total number of deaths in Sweden this year, compared to other years. These data are continuously provided by Statistics Sweden, so I downloaded the data as an Excel spreadsheet on May 14 . Let’s import that data
The sudden drop on day 60 some years is because it represents February 29, and the drop near day 130 for 2020 is likely due to a lag in reporting. For the first 80 days, i.e. until March 20, the death toll is quite average, or actually even less than average. Thus, when the media started to write about the Swedish experiment death tolls were still as expected. However, after that it is obvious that we have been way above the average, even though lately, just as Statistics Sweden says, the death tolls are getting closer to normal again. Note that there is always a couple of days delay in the reporting, so the last couple of points are less reliable.
An interesting thing to look at is how we compare the total for each year. So let us take the total for the first 125 days (January 1 through May 4):
Note that the leap years, i.e. 2016 and 2020, have one extra day compared to the others. 2020 is slightly higher than the second worst year, but as seen the difference is not striking.
One thing to notice is that Sweden's population has increased during this period, so to be fair one should take this into account. Using the population at the end of the previous year (as reported by Statistics Sweden) to normalize data, we get this graph
However, if you go back to the graph for daily number of deaths in Sweden it is clear that Sweden has had a clearly higher death rate than normal in April this year.
So, does this mean that the Swedish Experiment is working? Not necessarily, as it all depends on how far we have come through the pandemic. There is probably still a long way to go, and until we have reliable numbers on the total number of infected, it is not possible to make a verdict.
June 15, 2020
June 15, 2020
A month after I published the original post above, I thought I update it with what has happened since.
On May 12 the the Public Health Authority published the first results from ongoing antibody tests were presented. The analysis was based on tests from the last week of April, and showed that 3.7% - 7.3% of the tests showed antibodies (as it takes some time to get antibodies this shows the minimum level of people that had been infected to date). Tests also showed that while 6.7% in the age group 20 - 64 years had antibodies, only 2.7% of the elderly and 4.7% of the young had it. Indicating that protection of elderly had worked to some extent and that, as expected, letting kids attend school had not resulted in a lot of kids becoming infected.
Later, on May 29, it was decided to allow sports competitions from June 14, but without spectators. The potential effect of this is yet to be seen of course, so I will get back to that.
I downloaded the data as an Excel spreadsheet on June 15 . Let’s import that data and plot the daily number of deaths:
The trend of decreasing number of dead has continued, but until recently we continued on high levels. Let’s make it a bit more comparable by normalizing to deaths per 10 million inhabitants using the population form Dec 31 the year before (as reported by Statistics Sweden):
So, as could be expected, by now 2020 has surpassed 2015 as the worst of the last 6 years. This is how it looks like if we only look at the two:
Remember that a delay in reporting affects especially the last week, but to some extent previous weeks too. It looks like there will be a couple of interesting weeks to see if we are back to something close to normal or if it increases again.
Finally, on June 11 stated that the results from ongoing genetic testing showed that Corona arrived to Sweden from several different European countries and the USA, rather than mostly from Italy and Austria as believed in the beginning. This might explain why the virus spread more than anticipated in the beginning. This of course have long-term effects on the spread, which I hope to come back to in a separate post.
September 14, 2020
September 14, 2020
When I wrote the previous section in June 15, I was planning updates every month. But there has not been too much things happening in Sweden, so having a monthly update felt as it would be a bit too much. Anyways, now when vacations have past and Swedes are back to school/work I thought it would be a good time to follow-up.
Let’s start by comparing with 2015 again:
In the previous graph I plotted deaths per 10 million inhabitants. However, I decided to plot the total now as I learnt that it is more representative, even though Sweden’s population has increased with about 5% during the period. The reason for this is that the increase has mainly come in lowr age group, i.e. groups with a relatively low death rate. Nevertheless, the graph shows that we are on pretty much normal levels at the moment.
Let's look at accumulated deaths with COVID-19 since the beginning of the pandemic.
As can be seen the curve has flattened out substantially. Looking at it from June 15 shows that the curve is continuing to flatten.
There is a dip at the end of August, which might be confusing considering that it is an accumulated value. However, some Swedish regions had reported cases in a slightly different way then the official, which has then been corrected [REFERENS].
I downloaded the data as an Excel spreadsheet on September 7 . Let’s start by taking a look at deaths per age group for each gender from the beginning of 2019 and 2020 respectively.
There is a clear increase for both genders in all age groups, even though the increase for females, 64 years or less, is small. Let’s see how big the increase is
Now, to the question, did the changes in June 12 affect this? As it typically takes a few weeks from infection to possible death I will compare 60 days from July 3 - August 31, with the prior 60 days.
For males there seems to be no difference between age groups, while for female there is a smaller decrease (and even increase) for the younger groups. There are of course many other factors that might influence, but I would say that it is not obvious that we are protecting elderly better than before.
While most other countries change recommendations and regulations related to covid-19 on a regular basis, Sweden continues to have a strategy with few changes. A new law for restaurants and cafés was introduced on July 1, giving them increased responsibility for taking infection control measures (which were outlined the day after by the Public Health Authority), on July 30 they repeated that people should continue to work from home if possible, new recommendations for choirs were given on August 13, finally on August 31, children and youngsters with symptoms were recommended PCR testing in order to get back to school faster. Other then that, I believe that there has been no real changes, so the strategy has continued to be the same, but some minor details have been adjusted. At this point the infection has gone down, however it is likely to go up again at some point.
Except some minor differences (for instance in short term travel recommendations) all Swedish counties have been handled the same way, so it is interesting to compare outcome between them.
One region, Stockholm, has a clearly higher death rate than the others. Let’s use population data from 2019 to get the death rate per 100k people.
Still Stockholm is ahead of the rest, and it is easy to see that the development has varied a lot between regions, i.e. despite having the same strategy variations are huge. The principal explaining factor seems to regions were the pandemic grew too much before restrictions were put in place got a fast growth that took quite a bit of time to get under control.
In the beginning rather few tests were made, which can clearly be seen if we look at number of cases per county.
The main reason for the increase seen after about 15 weeks is increased testing. This illustrates how hard it is to say anything based on only number of known cases.
As the situation in Sweden as well as in other countries around the world has changed international medias view on the Swedish experiment has also shifted somewhat. Most media articles, like the (very interesting) article Anders Tegnell and the Swedish Covid experiment on September 11 in Financial Times are neutral. The same day the Daily Mail published an article, How comeback kid Sweden got the last laugh on coronavirus, comparing Britain’s and Sweden’s strategies.
But of course, there is still a long path o go before the pandemic and it’s long-term impact on economy, education, and health, can be summarized.