Computing with Tim Marcin’s “All 185 episodes of ‘The Office,’ ranked”
Computing with Tim Marcin’s “All 185 episodes of ‘The Office,’ ranked”
In May 2021, “All 185 episodes of ‘The Office’, ranked” dropped on Mashable. In this article, author Tim Marcin has distilled a year of research where he watched each episode of NBC’s sitcom TV show “The Office”, rating each in 4 categories. It’s a great article, which adds commentary and quotes to the ranking. But the quantitative side was limited only to the overall episode ranking, and you could do more with it. Which episode was best for laughs? How do the episodes vary over the course of a season? Which season is the best? (According to Kevin, summer thinks that it’s the best.) So here I endeavor to present that additional analysis.
Importing and creating the dataset
Importing and creating the dataset
Before we can do anything else, we need to get the data. If you want a quick start, you can load it here:
In[]:=
theOfficeEpisodeData=Import[CloudObject["user:jfklein/the-office-episode-dataset.wl"]]
Now skip to the next section, if you’re more interested in using the dataset. To see how the dataset was created, keep reading.
Create the dataset from the web
Create the dataset from the web
Using the dataset to answer questions
Using the dataset to answer questions
This is where the fun starts; what more can we pull out of this data?
Baseline
Baseline
Before we get to the really fun stuff, it’s helpful to calibrate our expectations of what the data looks like overall. This will help later in interpreting results.
What are the highest and lowest scores?
In[]:=
minMaxScores=MinMax[theOfficeEpisodeData[All,"Total"]]
Out[]=
{23.55,37.25}
What is the average episode score?
Mean[theOfficeEpisodeData[All,"Total"]]
Out[]=
29.1949
What’s the median episode score?
In[]:=
medianScore=Median[theOfficeEpisodeData[All,"Total"]]
Out[]=
29.01
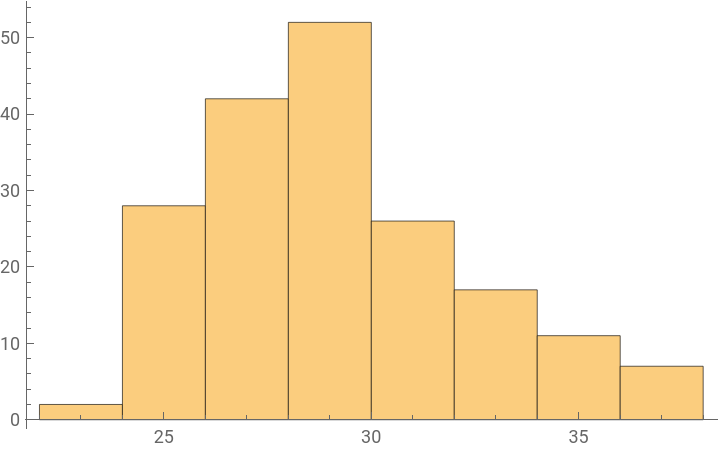
How are the scores distributed?
In[]:=
Histogram[theOfficeEpisodeData[All,"Total"]]
Out[]=
What percentage out of the total possible are the min, max, and median?
In[]:=
100*Append[minMax,medianScore]/40
Out[]=
{58.875,93.125,72.525}
So episode scores range from 23.55 to 37.25, out of a possible 0 to 40. They average 29.19, with the median at 29.01.
The percentages are reminiscent of school grading scales; some episodes may get a failing grade (sometimes considered as anything below 65%), some get an A (over 90%), and the median is a C (in the 70s). These are just arbitrary categorizations, but they can be handy for roughly understanding the stratifications of episode scores.
Within each category, let’s check the min-max ranges:
In[]:=
MinMax[theOfficeEpisodeData[All,"Laughs"]]
Out[]=
{5.77,10}
In[]:=
MinMax[theOfficeEpisodeData[All,"Importance to Office Universe"]]
Out[]=
{5.01,9.55}
In[]:=
MinMax[theOfficeEpisodeData[All,"Memorability, Quotability"]]
Out[]=
{5.01,9.88}
In[]:=
MinMax[theOfficeEpisodeData[All,"Emotional Weight"]]
Out[]=
{5.05,10}
This is a good point to stop and consider the categories themselves. The “Laughs” category is obviously essential for a comedy. The “Importance to the Office universe” may be the weakest category, but is still interesting. Earlier sitcom episides tended to be independent, with minimal character development and no story arcs across a season. Modern viewers expect these things, they want to see life events and major developments that cut into the show’s environment (will Dunder Mifflin downside the branch?). “Memorability and quotability” seems related, I think of it as a kind of “overall story impact” combined with “does this have gems that we now include in daily life”. The “Emotional weight” seems to be similar to “Importance to the Office universe”, but an episode may have importance without itself hitting you in the feels. It may just set up those moments. The author mentions that he liked to reward episodes with big, emotional moments.
How do the seasons rank?
How do the seasons rank?
In order to rank seasons, we’ll want a different dataset for each season. (You could also keep the original dataset and just select out each season, but this was my preference.) Create a list of datasets, one per season, sorted by episode number:
In[]:=
seasonDatasets=Table[SortBy[Select[theOfficeEpisodeData,#["Season"]===i&],Key["Episode"]],{i,9}];
Ranking the seasons presents a question, because each season aired different numbers of episodes, so simply totalling the scores of a season is meaningless. We can rank them by either average score or median score.
In[]:=
seasonRanksByMean=Table[{i,seasonDatasets[[i]][Mean,"Total"]},{i,Length[seasonDatasets]}]seasonRanksByMedian=Table[{i,seasonDatasets[[i]][Median,"Total"]},{i,Length[seasonDatasets]}]
Out[]=
{{1,28.7517},{2,30.6827},{3,30.4809},{4,28.98},{5,29.1164},{6,27.5513},{7,30.4054},{8,27.3313},{9,29.2143}}
Out[]=
{{1,29.1},{2,29.62},{3,30.31},{4,27.545},{5,29.4},{6,26.635},{7,31.235},{8,27.31},{9,28.24}}
Seasons ranked by mean score:
In[]:=
TableForm[ReverseSortBy[seasonRanksByMean,Last]]
Out[]//TableForm=
2 | 30.6827 |
3 | 30.4809 |
7 | 30.4054 |
9 | 29.2143 |
5 | 29.1164 |
4 | 28.98 |
1 | 28.7517 |
6 | 27.5513 |
8 | 27.3313 |
In terms of interpreting the data, this is already interesting. I tend to believe that good TV shows have a good first year (real clinkers get cancelled before a 2nd), but improve in their 2nd and 3rd years, and after that, who knows. With The Office, it’s well understood that the first season followed the British version more closely, and improved immensely when they made Michael both more sympathetic (less mean) and pathetic (you see his deep need for acceptance and belonging behind his actions) starting in the second season. But why is season 7 so high? This is the season where Steve Carrell as Michael leaves the show. Even though I remember how bad things were in the Will Ferrell episodes, I suspect many of the final episodes with Michael were scored, as they were both important to the Office universe and emotionally impactful.
Seasons ranked by median score:
In[]:=
TableForm[ReverseSortBy[seasonRanksByMedian,Last]]
Out[]//TableForm=
7 | 31.235 |
3 | 30.31 |
2 | 29.62 |
5 | 29.4 |
1 | 29.1 |
9 | 28.24 |
4 | 27.545 |
8 | 27.31 |
6 | 26.635 |
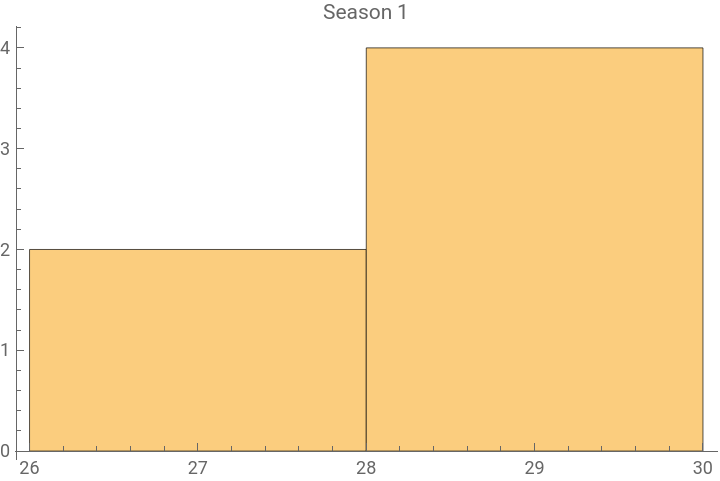
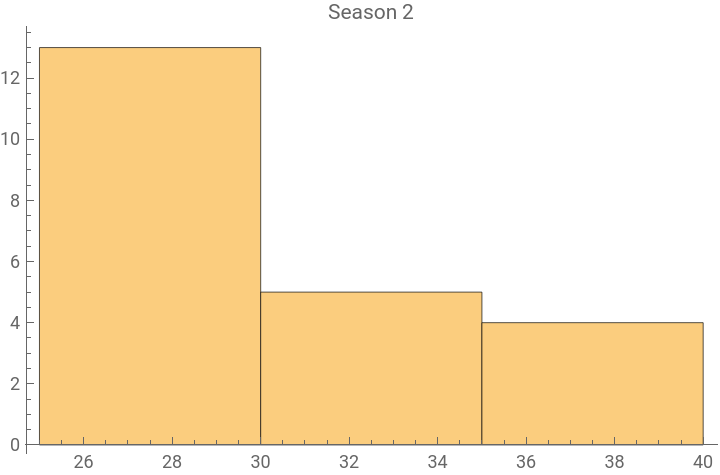
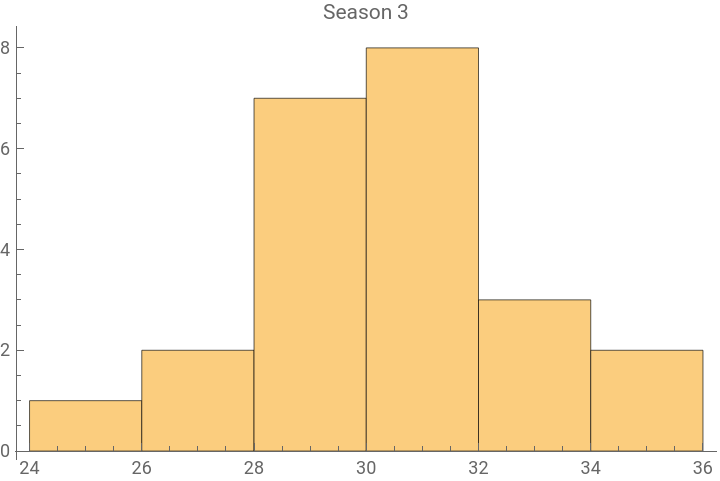
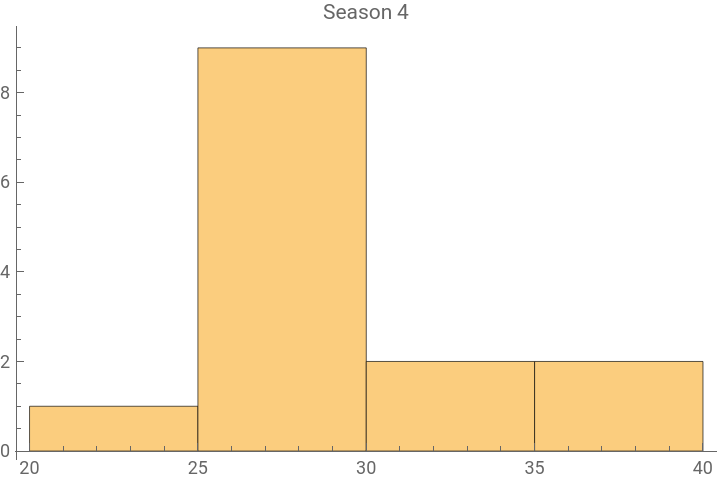
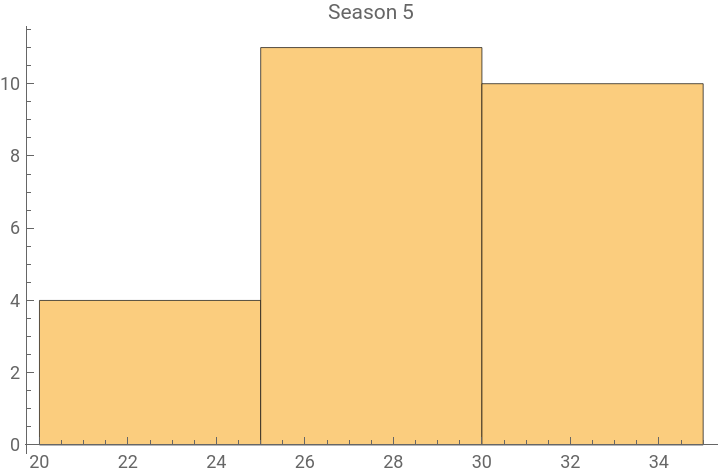
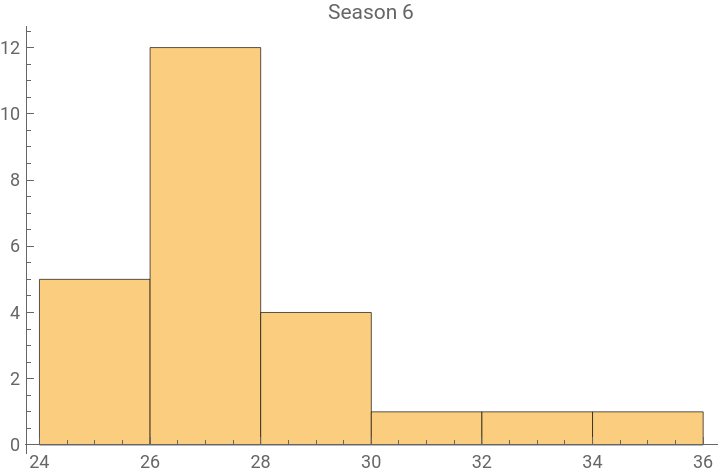
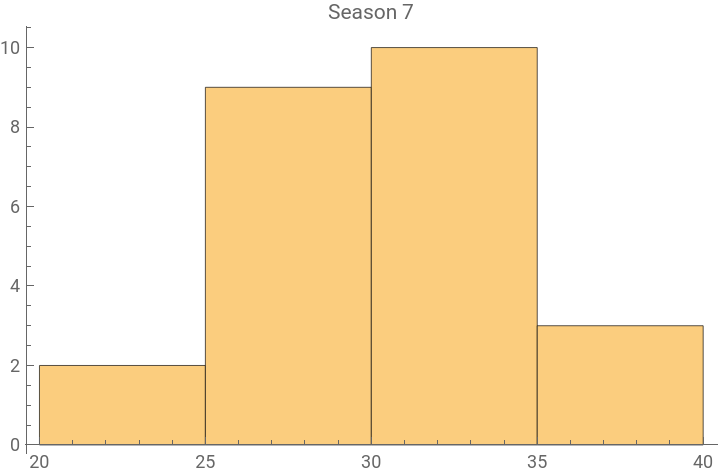
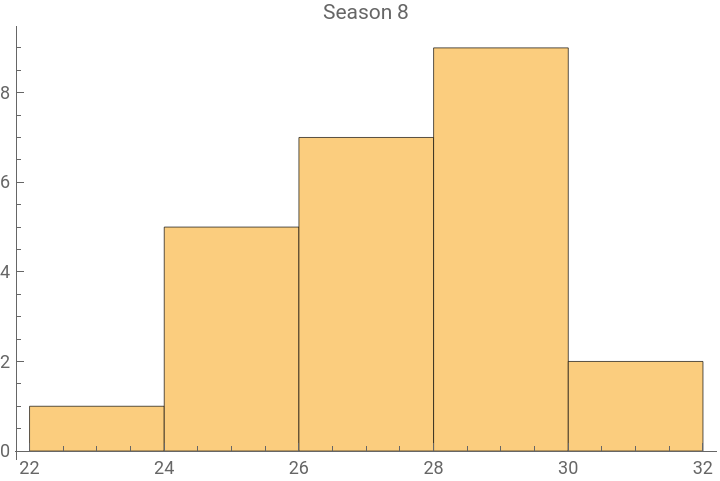
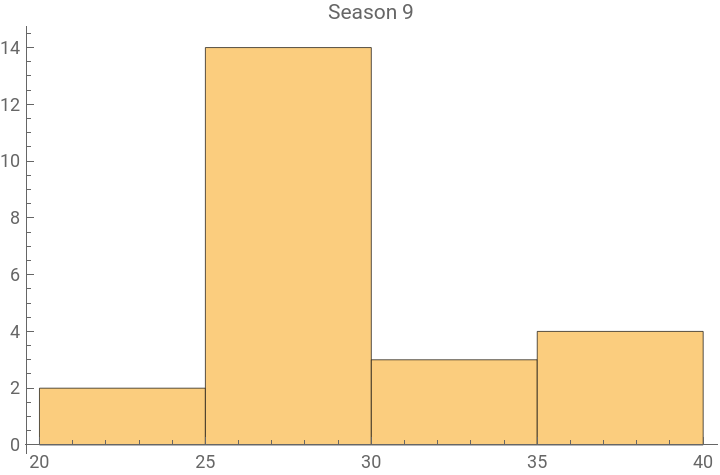
Using median, season 7, which I was just questioning as to why it was as high as 3rd, shoots to the top. Here’s where the “what’s the difference between mean and median” question comes in. One thing you can do here is look at the histograms of episode scores for each season. It’s possible that season 7 does have a lot of really good seasons, and the Will Ferrell episodes were low-scoring outliers that brought the mean down. Seasons 2 and 3 are still there at the top though, which suggests those seasons are consistent.
Let’s look at the histograms of total scores for each season:
In[]:=
Table[Histogram[seasonDatasets[[i]][All,"Total"],PlotLabel->"Season "<>ToString[i]],{i,Length[seasonDatasets]}]//Column
Out[]=
Season ranked by mean score over time:
Season ranked by median score over time:
Ranking the episodes within a category
Ranking the episodes within a category
Really, we want to know: what’s the funniest episode? Most impactful? Most memorable and quotable? Most important to The Office universe? To answer that, we want to construct separate datasets for each category.
First, we need a list of the category names, which we can extract from the data itself:
Then it’s straightforward to construct a dataset for each category:
Episodes sorted by Laughs:
What are the top 10?
And out of morbid curiosity, what the least funny?
Episodes sorted by Importance to the Office Universe:
Episodes sorted by Memorability, Quotability:
Episodes sorted by Emotional Weight:
How do the seasons rank across each category?
How do the seasons rank across each category?
Plot each category over the seasons:
The somewhat surprising thing here is the general trend of laughs is down, after the improvement from season 1 to 2.
Plot the episode ratings across the course of a season
Plot the episode ratings across the course of a season
The main thing I note here is the opening and finale of a season are expected to be strong, and we do see a lot of that, perhaps along with some strong Christmas episodes mid-season. But other than that, it’s a random roller coaster.
Result
Result
In this post we’ve done some additional analysis on Tim Marcin’s episode category data for The Office. Here are some results:
◼
Individual episodes are scored on a scale of 0-40, and they range from 23.55 to 37.25 with a median of 29.01 and an average of 29.19.
◼
Ratings in the “Laughs” category ranged from 5.77 to 10.
◼
Ratings in the “Importance to The Office universe” category ranged from 5.01 to 9.55.
◼
Ratings in the “Memorability, Quotability” category ranged from 5.01 to 9.88.
◼
Ratings in the “Emotional Weight” category ranged from 5.05 to 10.
◼
Ranking the seasons by median episode score, season 7 was the best (31.235) followed by season 3 (30.31), season 2 (29.62), then seasons 5, 1, 9, 4, 8, and finishing with season 6 (26.635).
◼
Ranking the seasons for each category, season 2 was best for Laughs and “Importance to Office Universe”; season 3 was best in “Memorability, Quotability”, and season 7 best for “Emotional Weight”. Season 9 was dead last in “Laughs”, season 6 last for “Importance”, seasons 6 and 8 were basically tied for last in “Memorability, Quotability”, and season 1 last in “Emotional Weight”.
◼
Best episode for “Laughs”? It’s “Dinner Party” (S4E9).
◼
Best episode in “Importance to Office Universe” is “Garage Sale” (S7E19).
◼
Top scoring episode in “Memorability, Quotability” is “Dinner Party” (S4E9).
◼
Top episode in “Emotional Weight” is no surprise, “Finale” (S9E23).
◼
When plotting episode score across a season, there is a general pattern that the season opener and finale are high-scoring.
Many of these give me insights; many I disagree with. In the end, this is just a view into how Tim Marcin views the Office. But I hope this is useful for both exploring a data set, and getting material to start friendly arguments the next chance you get.