Everyone’s vision is distinct due to optical structure. A range of the population have fewer cone cells, impacting the wavelength of photoreceptors in the retina. Regardless of the quantity of colorblind people, graphics are still designed with an adequate perspective of the RGB scale.This paper addresses this obstacle by receiving an image with a text color and a background color and manipulating its RGB values to produce a readability score. By performing this project, I plan to construct awareness of the matter, allowing future web designers to take a variation of visual perspectives into consideration. The solution consists of measuring the distance between RGB values compared to altered RGB scales of people who suffer from colorblindness. I encountered a discovery that people with color blindness have altered their perception of distance between colors due to the absence of cones in the eye. The larger the distance between the RGB values, the more colorblind friendly the graphic was due to a greater contrast. However, because an altered distance, colors that have large distances may appear smaller than they are, producing the effect of color differentiation between normal vision and color blindness for deficient colors.
Introduction
Introduction
The common understanding of the study of colorblindness revolves around the idea that a patient suffering with colorblindness is only impacted in which they cannot detect the contrast between red and green. However, the true problem originates from the second perspective, stemming from those who are unaware they commenced an obstacle. So, how do we complicate the lives of colorblind people with out even knowing? When performing tasks such as graphic design, the goal of the design is to make it appealing to viewers and easily accessible. However, when considering who will be examining the graphic, factors such as colorblindness are not considered.My project will be addressing this situation directly by performing code that allows the computer to rate the colorblind friendliness of a graphic based the RGB scale. The future of technology relies on the simplification of task; however, we must first attack accessibility before continuing further. The goal is to put technology to the test of inclusivity, and make society more aware of the trouble colorblind people face.
In[]:=
normalVision=ImageResize[ExampleData[{"TestImage","Apples"}],400]
Out[]=
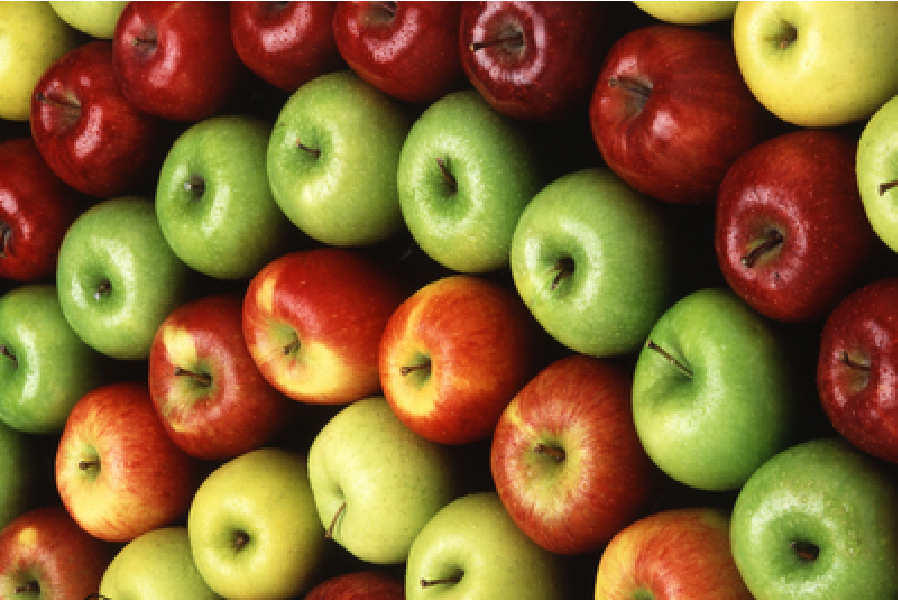
In[]:=
colorblindVison=ImageEffect[appleImage,"Deuteranopia"]
Out[]=
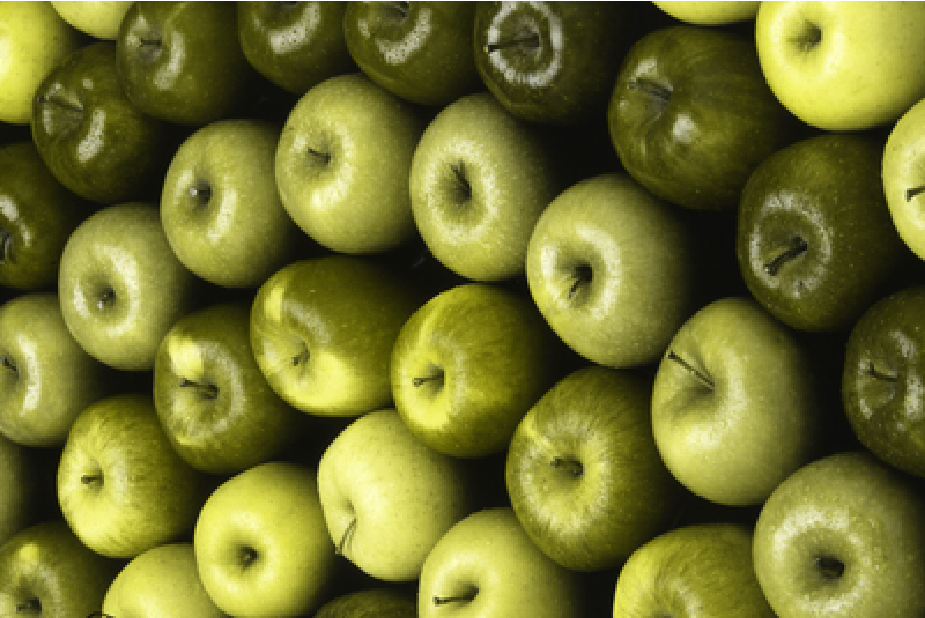
Background Information
Background Information
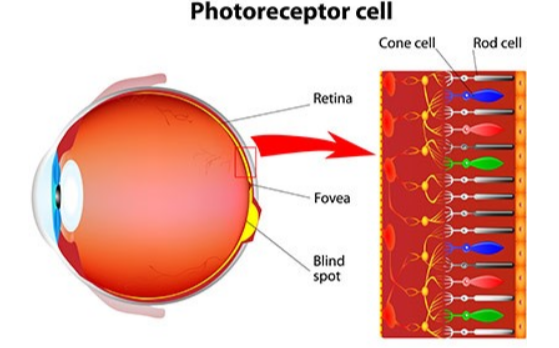
The difference between normal vision and colorblind vision is differed by how our eyes perceive light. Visualization of light is constructed by three cone types, red, green, and blue. These cones co relate with the types of color blindness in which a deficiency or a missing cone can result in deuteranopia, tritanopia, or protanopia. The mixture of deficient hues with other colors challenges the colorblind person’s eye recognition of color. The setting of contrast is relied on to differentiate colors and shades. In the case of which the color contrast is not high enough, the colors may not be visible or distinguished. An example used to simplify the idea of color differentiation on a scale is black and white. Imagine white text on a white background. Because the color has the same settings, it is impossible to identify the text aside from the background. However, in the case of black text on a white background, the settings are opposites, therefore, it is the easiest to identify. When scored, white text on a white background would receive a 0%, as a white background with black text would receive a 100%. The scoring mechanic of the project is presented through the self constructed equation "Round[100Norm[colorCBCoordinate1-colorCBCoordinate2]/Sqrt[3]]" in which it scales from 0% to 100%.
Methodology
Methodology
I approached the problem by visualizing the distance between RGB values in order to distinguish the compatibility of colors when perceived from a color blind person. By designing a graphic consisting of two colors, I was capable to extract the image data of the RGB values within the colors shown. Measuring the total euclidean distance of the given cube was an asset to locating the readability score. By using the function "Norm" I was able to subtract the coordinates of the two colors in the custom graphic and produce the distance. In the case of a colorblind viewpoint, I used the function "ImageEffect" in order to demonstrate a colorblind scale. Repeating the same steps, I was able to compare both distances successively proving the concept of color distance.
Initially, my approach was to use HSB (Hue,Saturation,Brightness) color space in order to measure the distance. However when I viewed the graphics and compared to the readability score, the data was inaccurate. As you can see in the images below, the first image is hard to view for someone suffering from color blindness due to the deficiency in red, however, it received a score of 81%. Below that image, is two others. One being easy to see, receiving a score of 25%, and another image that is difficult to see, receiving a score of 47%. Proving that HSB color space is inaccurate when producing a readability score.
In[]:=
fontColor={1,1,1};(*Coloroftext*)backgroundColor={1,2,0};(*Colorofbackground*)Graphics[(*CreatesagraphicusingHSBcolorspace*){Hue[fontColor],Text[Style["Hello",FontSize30],{0,0}]},PlotRange->100,BackgroundHue[backgroundColor],ImageSize100]100.Norm[fontColor-backgroundColor]
3
Out[]=

Out[]=
81.6497
In[]:=
fontColor={0.4,0.4,0.8};(*Coloroftext*)backgroundColor={0.2,0.4,0.4};(*Colorofbackground*)Graphics[(*CreatesagraphicusingHSBcolorspace*){Hue[fontColor],Text[Style["Hello",FontSize30],{0,0}]},PlotRange->100,BackgroundHue[backgroundColor],ImageSize100]100.Norm[fontColor-backgroundColor]
3
Out[]=

Out[]=
25.8199
In[]:=
fontColor={0.2,0.2,0.2};(*Coloroftext*)backgroundColor={0.,1.,0.2};(*Colorofbackground*)Graphics[(*CreatesagraphicusingHSBcolorspace*){Hue[fontColor],Text[Style["Hello",FontSize30],{0,0}]},PlotRange->100,BackgroundHue[backgroundColor],ImageSize100]100.Norm[fontColor-backgroundColor]
3
Out[]=

Out[]=
47.6095
Creates a list of color values in RGB color space
In[]:=
someColors=Flatten[Table[{r,g,b},{r,0,1,0.2},{g,0,1,0.2},{b,0,1,0.2}],2];
Graph of RGB colors in a normal vision perspective
In[]:=
Graphics3D[{RGBColor[#],PointSize[0.03],Point[#]}&/@someColors,Background->LightGray,Axes->True,AxesLabel{"Red","Green","Blue"}]
Out[]=

Converts normal color coordinates into deuteranopia colorblind color coordinates
Creates a list of colorblind values in RGB color space
Gives a graph of color coordinates in a colorblind perspective
Finds the distance between the text color and the background color in both normal and color blind vision using image effect and euclidian distance.
Gives the color of the text
Gives the color of the background
Creates the graphic using the given text and background color
Shows the distance between the background and text colors in both normal and colorblind vision
Results/Discussion
Results/Discussion
Gives the color of the text
Gives the color of the background
Creates the graphic using the given text and background color
Shows the distance between the background and text colors in both normal and colorblind vision
Gives the color of the text
Gives the color of the background
Creates the graphic using the given text and background color
Shows the distance between the background and text colors in both normal and colorblind vision
Conclusion
Conclusion
Bibliography
Bibliography
Acknowledgements
Acknowledgements
Thank you to my mentor James Choi for helping me with my code, and Steven Wolfram for suggesting the project concept as well as advising certain functions in the wolfram language.