1 : children
2: adults
:Prevalence in children
:Prevalence in adults
:Number of children in the population
:Number of adults in the population
: for of Infection experienced by children
: for of Infection experienced by adults
2: adults
I
1
I
2
N
1
N
2
FoI
1
FoI
2
Differential Equations for Adults
d
S
2
dt
λ
2
S
2
d
I
2
dt
λ
2
S
2
I
2
R
2
dt
I
2
For an age structured model, we' re going to assume for simplicity that all age groups have the same infectiousness . This is the probability of infection per contact .
b
λ
2
c
21
I
1
N
1
c
22
I
2
N
2
let’s think about a single susceptible adult in the population and the number of contacts per unit time between that adult and children in the population,where where the 2 denotes the adult that we’re focusing on, and the 1 denotes children and similarly for . And similarly for the other forces of infection.
c
21
c
22
we assume that children and adults all recover from the infection at the same rate .
γ
We are going to modelling an outbreak in a population where children make 13 contacts per day on average, of which 7 are with other children, and that adults make 11 contacts per day on average, of which 10 are with other adults .This gives the following contact parameters:
c
11
c
12
c
21
c
22
We also assume that the probability of infection per contact, , is the same for children and adults and equals 5 % for the disease we are modeling, and that people remain infected on average for 5 days . The total population size is 1 million, and children make up 20 % of that population .
b
Based on this information, we are going to simulate an infection in a totally naive (unexposed) population over the course of 3 months.
In[]:=
Clear["Global`*"]
In[]:=
(*Recoveryrate*)γ=1/5;
In[]:=
(*theprobabilityofinfectionpercontact*)
In[]:=
b=0.05;
In[]:=
(*dailynumberofcontactsthatchildrenmakewitheachother*)
In[]:=
c11=7;
In[]:=
(*dailynumberofcontactsthatchildrenmakewithadults*)
In[]:=
c12=6;
In[]:=
(*dailynumberofcontactsthatadultsmakewithchildren*)
In[]:=
c21=1;
In[]:=
(*dailynumberofcontactsthatadultsmakewitheachother*)
In[]:=
c22=10;
In[]:=
(*TotalPopulationSize*)n=1000000;
In[]:=
(*thepopulationofchildrensusceptible*)
In[]:=
n1=0.2*n
Out[]=
200000.
In[]:=
(*thepopulationofadultsusceptible*)
In[]:=
n2=n-n1
Out[]=
800000.
In[]:=
(*periodoftimeindays*)
In[]:=
tmax=90;
In[]:=
(*Forceofinfectionactingonsusceptiblechildren:*)
In[]:=
λ1[t_]:=b*c11*i1[t]/n1+b*c12*i2[t]/n2;
In[]:=
(*Forceofinfectionactingonsusceptibleadults:*)
In[]:=
λ2[t_]:=b*c21*i1[t]/n1+b*c22*i2[t]/n2;
In[]:=
(*Definethesystemofdifferentialequations*)
In[]:=
(*Rateofchangeinchildren:*)
In[]:=
eqns1={s1'[t]==-λ1[t]*s1[t],i1'[t]==λ1[t]*s1[t]-γ*i1[t],r1'[t]==γ*i1[t],s1[0]==n1,i1[0]==1,r1[0]==0};
In[]:=
eqns2={s2'[t]==-λ2[t]*s2[t],i2'[t]==λ2[t]*s2[t]-γ*i2[t],r2'[t]==γ*i2[t],s2[0]==n2,i2[0]==0,r2[0]==0};
Solve the system
sol=NDSolve[{eqns1,eqns2},{s1,i1,r1,s2,i2,r2},{t,0,tmax}];
Plot the solutions
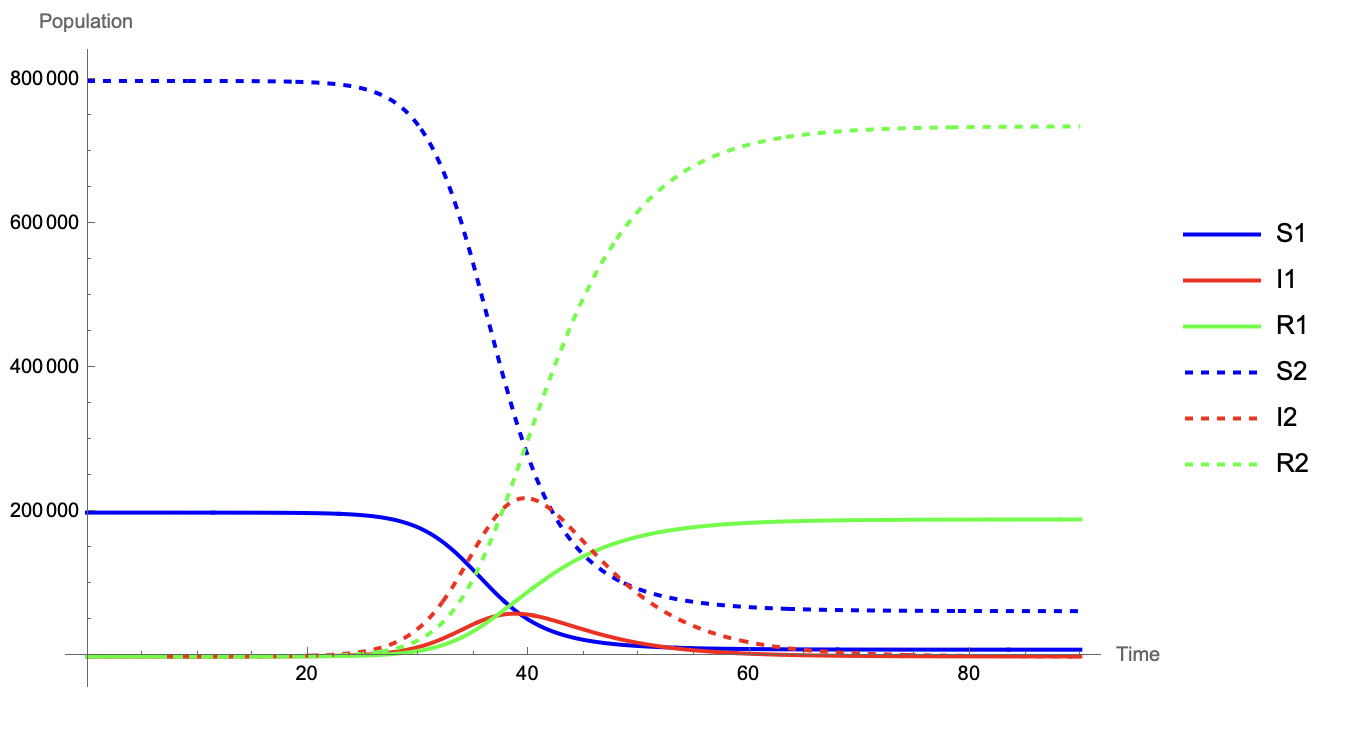
Plot[Evaluate[{s1[t],i1[t],r1[t],s2[t],i2[t],r2[t]}/.sol],{t,0,tmax},PlotLegends->{"S1","I1","R1","S2","I2","R2"},AxesLabel->{"Time","Population"},AxesLabel->{"Time","Population"},PlotRange->All,PlotStyle->{Blue,Red,Green,{Blue,Dashed},{Red,Dashed},{Green,Dashed}},ImageSize->Large]
Out[]=
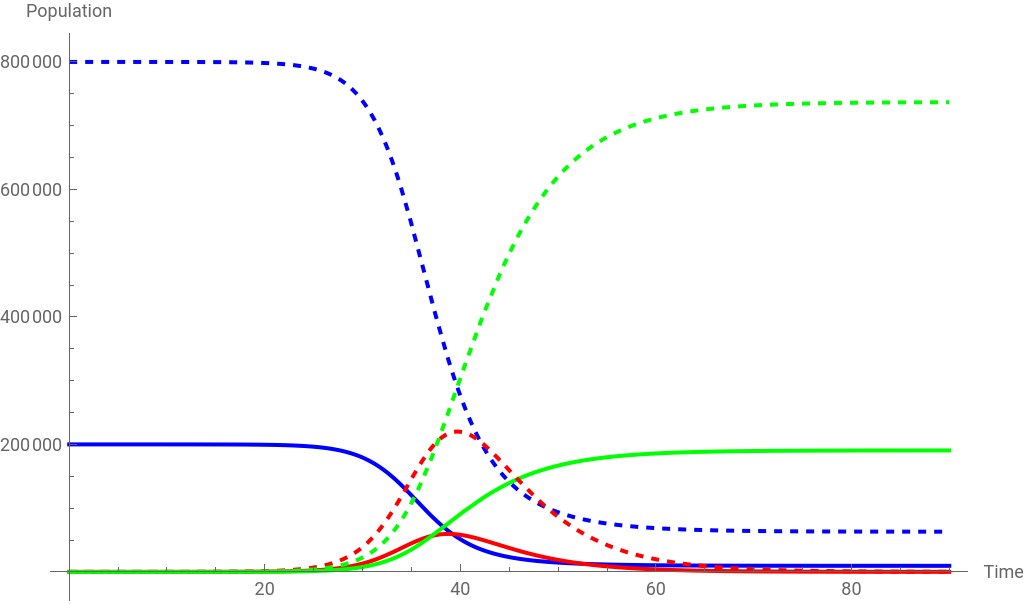


Cumulative incidence function for children
Cumulative incidence function for children
inc[tmax_]:=NIntegrate[λ1[t]s1[t]/.sol,{t,0,tmax}];
In[]:=
cump1=Plot[inc[u],{u,0,100},AxesLabel->{"Time","Incidence"},PlotLegends->{"cumulative incidence"},PlotStyle->{Black}]
Out[]=

In[]:=
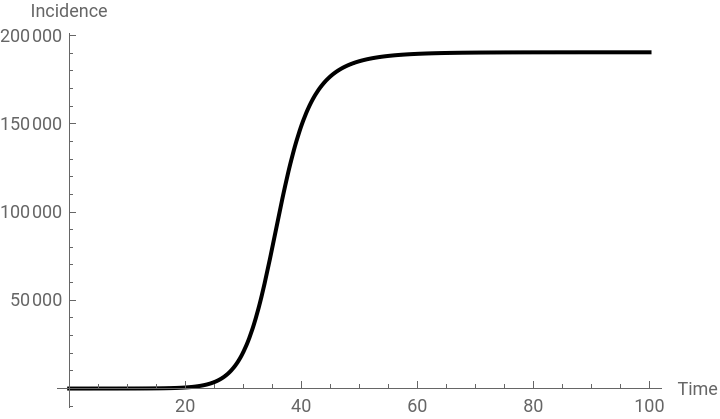
p1=Plot[Evaluate[i1[t]/.sol],{t,0,100},PlotLegends->{"Infected"},AxesLabel->{"Time","Population"},PlotStyle->{Red}]
Out[]=

From this, we can see that a total of 190511 cases of children occurred during the epidemic . This number is the cumulative incidence .
Calculate the proportion of infections in children
Calculate the proportion of infections in children
Cumulative incidence function for adults
Cumulative incidence function for adults
From this, we can see that a total of 736937 cases occurred during the epidemic . This number is the cumulative incidence .
927,448 people became infected during this epidemic.
Calculate the proportion of infections in adults
Calculate the proportion of infections in adults
Which age group was most affected by the epidemic?
Which age group was most affected by the epidemic?
To determine which age group was most affected by the epidemic, you can compare the proportions of infections in children and adults . The age group with the higher proportion of infections is the one that was most affected .
◼
Proportion of infections in children
◼
Proportion of infections in adults
Over the course of this epidemic, 95 % of all children and 92 % of all adults were infected . Children were therefore slightly more affected in proportion to their population size, even though the majority of infections occurred in adults .
CITE THIS NOTEBOOK
CITE THIS NOTEBOOK
Modeling heterogeneous dynamics: age-structured extensions to the SIR model
by Athanasios Paraskevopoulos
Wolfram Community, STAFF PICKS, September 12, 2023
https://community.wolfram.com/groups/-/m/t/3011393
by Athanasios Paraskevopoulos
Wolfram Community, STAFF PICKS, September 12, 2023
https://community.wolfram.com/groups/-/m/t/3011393