Comparing Gamma and Log-Normal Distributions
Comparing Gamma and Log-Normal Distributions


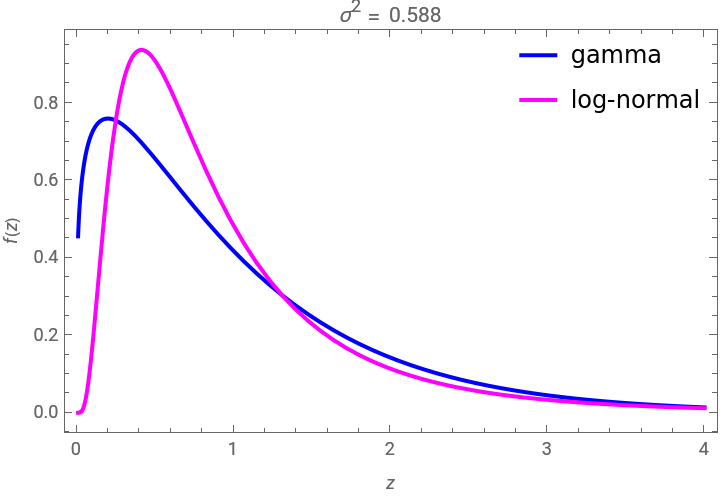
This Demonstration compares the gamma distribution and the log-normal distribution . Both of these distributions are widely used for describing positively skewed data. Various distribution plots are shown as well as a table comparing the coefficients of skewness and kurtosis, denoted by and , respectively. Plots of the probability density function (pdf) of the distributions are useful in seeing the overall shape of the distribution but other plots provide additional insights. For example, the plot and normal probability plot are better for showing small differences in the tails.
G
α,β
L
μ,σ
γ
1
γ
2
q-q
Our purpose is to compare the shapes of the gamma and log-normal distributions, so we fix their means to be 1 and constrain their coefficients of variation to be equal. These assumptions require that the log-normal parameter is =log(1+) and that the second gamma parameter is .
2
σ
-1
α
β=
1
α
Details
Details
Snapshot 1. The q-q plot can be used to compare two distribution functions by plotting the quantiles of one distribution against those of another. It is the best plot to use to highlight the differences in the tails of the distributions[1]. The concave shape of the plot in the upper right quadrant indicates that gamma distribution has a slightly thicker right tail than the log-normal distribution when .
α=1.25
Snapshot 2: The normal probability plot displays the quantiles of the gamma/log-normal distribution versus the standard normal. From this plot we see that relative to normal, both the gamma and lognormal distributions have thicker right tails. Since the gamma and log-normal distributions are truncated at zero, outliers on the left cannot occur, so both distributions have thin left tails relative to the normal.
Snapshot 3: The q-q plot with shows that the right tail of the log-normal is thicker than the gamma due to the convex curve of the q-q plot. By experimenting with various we found that when , the distributions are similar in the right tails, while for smaller values of , the gamma distribution has thicker right tails. As increases past 1.6, the right tail for the log-normal becomes heavier.
α=15.15
α
α≈1.6
α
α
Snapshot 4. The p-p plot is a another parametric plot showing , where is the cumulative distribution function (cdf) of the indicated distribution. The p-p plot is not as sensitive to differences in the tails of the distribution as the q-q plot, but is sometimes helpful in highlighting other differences. This type of plot is briefly discussed in[2].
Fz;,F(z;)
G
α,β
L
μ,σ
F
Snapshot 5. The plot of the cdf also provides a visual summary that is useful for comparing distributions.
Snapshot 6. The survival function is the complement of the cdf and provides another visual comparison.
Snapshot 7. The hazard function is compared when ; the gamma distribution has a constant failure rate, whereas the log-normal does not.
α=1
Snapshot 8. The table shows that when the coefficients of skewness and kurtosis are larger for the log-normal distribution than the gamma distribution. This is true for all values of as may be verified by experimenting with other values of or by using Mathematica symbolics to derive algebraic formulas for the skewness and kurtosis for the gamma and log-normal distributions subject to the constraints.
α=1.25
α
α
References
References
[1] W. S. Cleveland, Visualizing Data, Summit, NJ: Hobart Press, 1993.
External Links
External Links
Permanent Citation
Permanent Citation
Abdelhameed El-Shaarawi, Nagham Muslim Mohammad, Ian McLeod
"Comparing Gamma and Log-Normal Distributions"
http://demonstrations.wolfram.com/ComparingGammaAndLogNormalDistributions/
Wolfram Demonstrations Project
Published: August 12, 2013