Explore viral dynamics on the abstract “Ledom Island,” a fictional construct inspired by an online module from the University of Delft via EDx. This study employs differential equations to model the flu-like virus’s progression within this theoretical ecosystem.
Ledom Island is inhabited by the native Htam . The island and its people were discovered in the 15 th century by a group of 20 explorers . The explorers recorded that when they reached the island there were 980 Htam .
Unfortunately, the explorers all were sick with the flu when they arrived . They decided to stay for some time on the island and only to continue their travels after they had recovered .
The explorers infected the Htam people and all of them got the flu as well . In no time, the whole island was ill with the flu . Fortunately, no one died .
When the 20 sick explorers arrived, they infected the 980 Htam people on Ledom Island with the flu .
You want to investigate how the resulting flu epidemic might have developed .
You want to investigate how the resulting flu epidemic might have developed .
t
F(t)
X(t)
F(t)
1000
In[]:=
X[t_]=F[t]/1000
Out[]=
F[t]
1000
In[]:=
F[0]=20
Out[]=
20
In[]:=
N[X[0]]
Out[]=
0.02
To quantify the number of newly infected people, we need two more numbers :
•: the number of encounters of pairs of people on the island each day .
• : the chance that one encounter between an infected and a healthy person results in infection of the healthy person .
•
E
•
P
i
The relation between parameters and the other constants is
k
k
E
P
i
500
he differential equation for the fraction of people on Ledom Island infected with the flu virus is
X(t)
dX
dt
where is a positive parameter. The initial condition is
k
X(0)0.02
In[]:=
Clear["Global`*"]
For now we consider
In[]:=
k=0.3;
In[]:=
eqn=x'[t]==k*x[t]*(1-x[t]);
In[]:=
ic=x[0]==0.02;
In[]:=
sol=DSolve[{eqn,ic},x[t],t];

In[]:=
p1=Plot[x[t]/.sol,{t,0,30},AxesLabel->{"Time (days)","Fraction X(t)"},PlotStyle->Green]
Out[]=
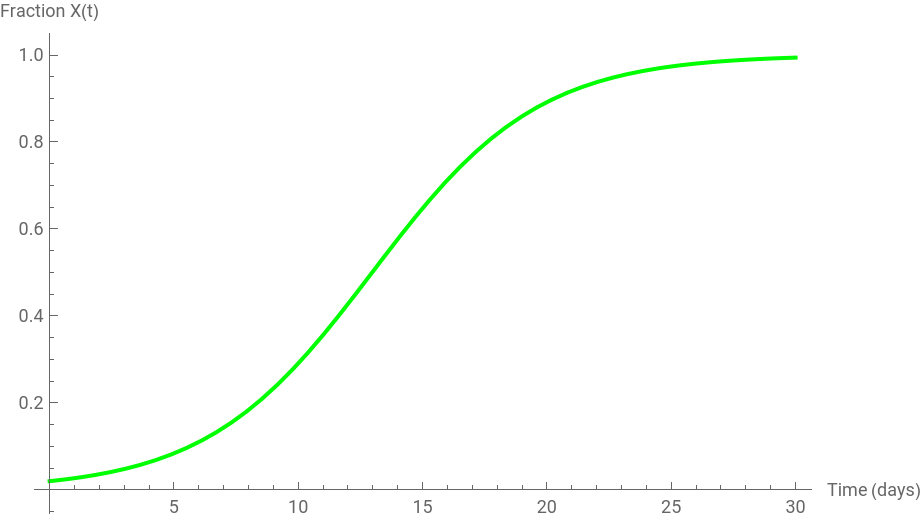
The Equilibrium points
In[]:=
eqn1=k*x[t]*(1-x[t])==0;equilibriumPoints=Solve[eqn1,x[t]]
Out[]=
{{x[t]0},{x[t]1}}
In[]:=
kVal=3;(*Examplevaluefork*)eqn=k*x*(1-x)==0;VectorPlot[{1,k*x*(1-x)}/.k->kVal,{t,0,10},{x,-0.5,1.5},VectorPoints->Fine,Epilog->{Red,PointSize[Large],Point[{0,x}/.Solve[eqn/.k->kVal,x]],Point[{10,x}/.Solve[eqn/.k->kVal,x]]},Axes->True,AxesLabel->{"t","x[t]"},PlotLabel->"Direction Field with Equilibrium Points"]
Out[]=
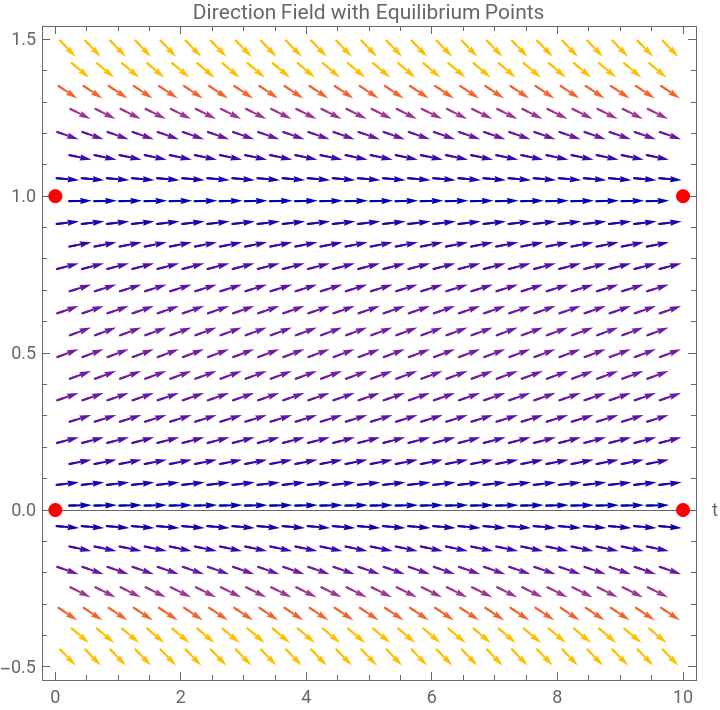
The points are stable or unstable and why ?
In[]:=
Clear["Global`*"]
Problem extension
Problem extension
We have encountered the Htam people on Ledom Island :
Ledom Island is inhabited by the native Htam . The island and its people were discovered in the 15 th century by a group of 20 explorers . The explorers recorded that when they reached the island there were 980 Htam .
Unfortunately, the explorers all were sick with the flu when they arrived . They decided to stay for some time on the island and only to continue their travels after they' d have recovered .
The explorers infected the Htam people and all of them got the flu as well . In no time, the whole island was ill with the flu . Fortunately, no one died .
Some years ago, a group of modern - day explorers went to Ledom Island, and found evidence of the flu epidemic recorded on the wall of a cave deep in the forest . Translated from the language Relue, this text read :
Twenty days after the foreigners arrived, already 730 Htami have fallen ill to this strange sickness .
The new information can be rewritten as :
X(20)0.75
In[]:=
k1=.25
Out[]=
0.25
In[]:=
eqn=x'[t]==k1*x[t]*(1-x[t])
Out[]=
′
x
In[]:=
cond={x[20]0.75};
In[]:=
sol1=DSolve[{eqn,cond},x[t],t]
Out[]=
x[t]
0.25t
2.71828
49.4711+
0.25t
2.71828
In[]:=
p2=Plot[x[t]/.sol1,{t,0,30},AxesLabel->{"Time (days)","Fraction X(t)"},PlotStyle->Gray]
Out[]=
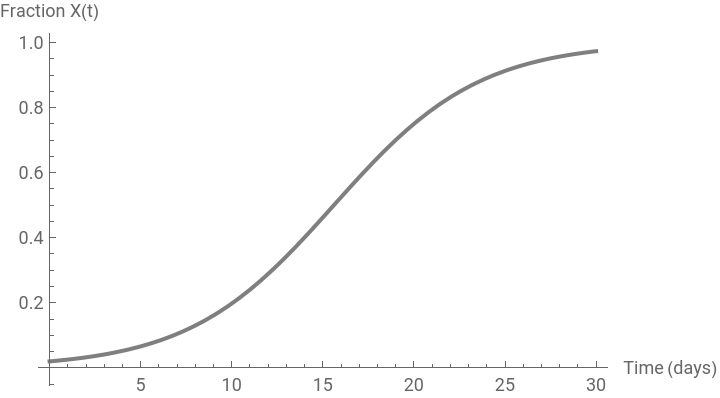
The Euler' s Method
The Euler' s Method
In[]:=
sol2=NDSolve[{eqn,cond},x[t],{t,0,30},Method->"ExplicitEuler"]
Out[]=
x[t]InterpolatingFunction
[t]


In[]:=
p3=Plot[x[t]/.sol1,{t,0,30},PlotStyle->{Dashed,Red}]
Out[]=
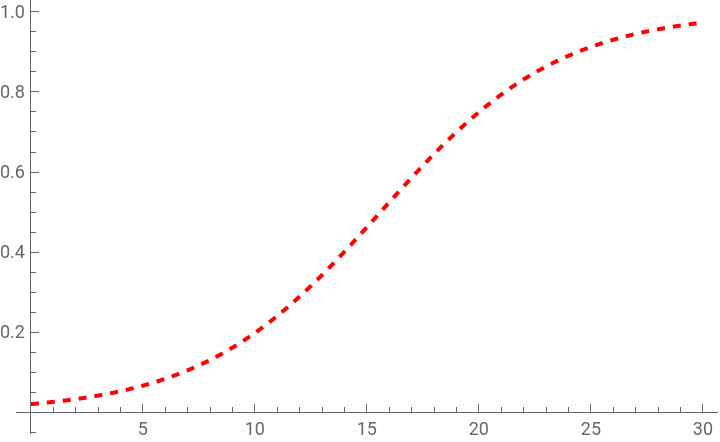
In[]:=
Show[p1,p3,PlotLabel->"Comparison of Solutions"]
As we can see both ways are quite accurate
CITE THIS NOTEBOOK
CITE THIS NOTEBOOK
Dynamics of viral spread in an abstract island ecosystem
by Athanasios Paraskevopoulos
Wolfram Community, STAFF PICKS, August 15, 2023
https://community.wolfram.com/groups/-/m/t/2991457
by Athanasios Paraskevopoulos
Wolfram Community, STAFF PICKS, August 15, 2023
https://community.wolfram.com/groups/-/m/t/2991457