AreaSpheresPlane::usage="Calculate the area in red (visualize the figure in 3D).References: Internet: Ronny on line (figure); Personal.";
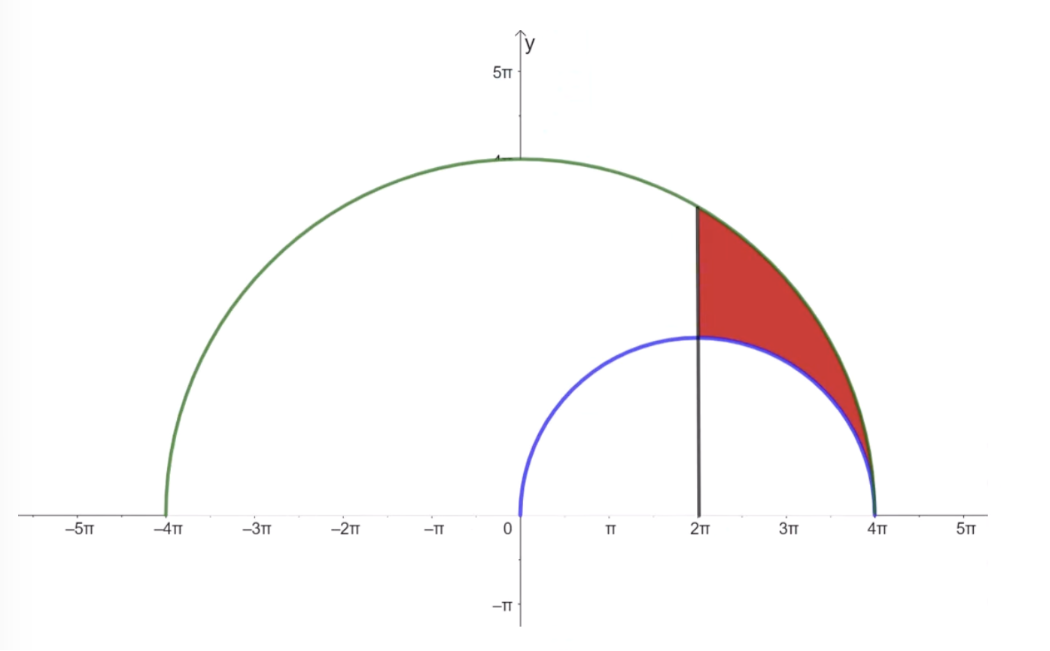
Development for surface area:
Method 1:
In[]:=
A1=A2=2
π-π
2
2
3
π2
(2π)
2
4π
∫
2π
16-
-2
π
2
x
4-
x2
π
2
(x-2π)
4;
3
π
2-2+;
3
2
π
5
3
π
3
In[]:=
f[x_]:=πf[x]
16-
;A3=2
π
2
x
4π
∫
2π
1+
x2
f'[x]
8;
3
π
In[]:=
g[x_]:=πg[x]
4-
;A4=2
π
2
(x-2π)
4π
∫
2π
1+
x2
g'[x]
4;
3
π
In[]:=
A=4+2-2++8+4//FullSimplify
3
π
3
2
π
5
3
π
3
3
π
3
π
Total area:
2
3
2
π
3
+29π;Method 2:
In[]:=
ℜ=ImplicitRegion[++<=16&&++>=4&&x>=2π&&z>=0,{x,y,z}];SurfaceArea[ℜ]
2
x
2
y
2
z
2
π
2
(x-2π)
2
y
2
z
2
π
-6-29;-6
2
3
3
2
π
3
π
2
3
2
π
3
+29π;Animation:
In[]:=
Manipulate[Show[ContourPlot3D[{++==16,++==4},{x,2π,4π},y,-2++<=16&&++>=4&&x==2π&&z>=0,{x,2π,4π},y,-2++<=16&&++>=4&&z==0,{x,2π,4π},y,-2
2
x
2
y
2
z
2
π
2
(x-2π)
2
y
2
z
2
π
3
π,23
π,{z,0,t1},ContourStyle->Directive[Red,Opacity[0.5],Specularity[White,40]],Mesh->None],RegionPlot3D[2
x
2
y
2
z
2
π
2
(x-2π)
2
y
2
z
2
π
3
π,23
π,{z,0,t1},Mesh->None,PlotStyle->Directive[Red,Opacity[0.5],Specularity[White,40]]],RegionPlot3D[2
x
2
y
2
z
2
π
2
(x-2π)
2
y
2
z
2
π
3
π,23
π,{z,0,t1},Mesh->None,PlotPoints60,PlotStyle->Directive[Red,Opacity[0.5],Specularity[White,40]]],AxesLabel->(Style[#,15,Blue]&/@{"X","Y","Z"}),Axes->True,Boxed->False,BoxRatios->Automatic,ViewPoint->{-1,-2.4,1.},ImageSize700,PlotRange{2π,4π},-23
π,23
π,0,23
π],{{t1,0.00002,"Value (t1)"},0.00001,2Sqrt[3]π,0.00001},ControlPlacement->Top]Out[]=


Note: Thank you very much for your contributions: Gianluca Gorni and Michael Rogers. The hole disappeared!!
A new and very interesting contribution by Michael Rogers:
In[]:=
gr=Blockt1=2-Sqrt[+];Transpose@n(x-2π)+2π,ny,Min,1z;plot=ParametricPlot3D4π{Sin[u]Cos[w],Sin[u]Sin[w],Cos[u]},u,ArcCos,,w,ArcCos,-ArcCos,Mesh->None,PlotStyle->{Red,Opacity[0.5],Specularity[White,40]},PlotPoints->{Ceiling[5+8t1],25},BoundaryStyle->Black,WorkingPrecision->24,Method->{"BoundaryOffset"->False};(*Sorttoensurevertex-to-vertexorientation(y=#[[2]],z=Last)*)bdypts=First@Cases[Normal@plot,Line[p_]:>p,Infinity];outerX2PiNeg=SortBy[Cases[bdypts,{x_,y_,z_}/;x==2π&&y<=0],Last];outerX2PiPos=SortBy[Cases[bdypts,{x_,y_,z_}/;x==2π&&y>=0],-Last[#]&];outerZ0=SortBy[Cases[bdypts,{x_,y_,z_}/;z+1==1.],-#[[2]]&];outerZT1=SortBy[Cases[bdypts,{x_,y_,z_}/;z==t1],#[[2]]&];{innerX2PiNeg,innerX2PiPos,innerZ0,innerZT1}=Reverse/@xform/@{outerX2PiNeg,outerX2PiPos,outerZ0,outerZT1};plot=plot/._Line->{};(*removeboundaryline*)Show[Graphics3D[{},PlotRange->All,Axes->True,AxesLabel->{x,y,z},AxesOrigin->{0,0,0},Boxed->False,BoxRatios->Automatic,ViewPoint->{-1,-2.4,1.},ImageSize700,PlotRange{2π,4π},-2
3
π-0.00001,xform[pts_]:=Module{x,y,z,n},{x,y,z}=Transpose[pts];n=Sqrt42
π
2
Min,1z
2π
t1
2
(x-2π)
2
y
2π
t1
t1
4π
π
2
Csc[u]
2
Csc[u]
2
3
π,23
π,0,23
π],plot,plot/.GraphicsComplex[pts_,rest___]:>With[{xpts=xform[pts]},GraphicsComplex[xpts,rest]/.(VertexNormals->_)->VertexNormals->Normalize/@(#-{2π,0,0}&/@xpts)],Graphics3D[{Red,Opacity[0.5],{Polygon[Join[outerX2PiNeg,outerX2PiPos,innerX2PiPos,innerX2PiNeg]],Polygon[Join[outerZ0,innerZ0]]},If[t1<2π,Polygon[Join[outerZT1,innerZT1]],Polygon[outerZT1]]}],PlotLabel->HoldForm[t1]==t1]