Exploring Skewness in Box Plots
Exploring Skewness in Box Plots
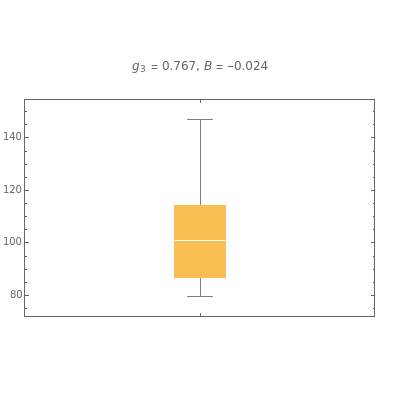
The box-and-whisker plot, also known simply as the box plot, is useful in visualizing skewness or lack thereof in data. The usual form of the box plot, shown in the graphic, shows the 25% and 75% quartiles, and , at the bottom and top of the box, respectively. The median, , is shown by the horizontal line drawn through the box. The whiskers extend out to the extremes. For brevity, the whiskers at the top and bottom are referred to as the positive and negative whiskers.
Q
1
Q
3
m=
Q
2
In judging skewness, positive skewness (or right-skewed) distributions are often indicated by -m>-m, which is usually apparent from inspection of the box plot. This condition is equivalent to , where is the quartile skewness coefficient. This Demonstration shows that using , , and in this way is not a reliable way to judge skewness when the sample size is not large, as in or . Skewness, denoted by , is more reliably indicated visually by the relative size of the whiskers. A large positive whisker relative to the negative whisker is a better indication of positive skewness.
Q
3
Q
1
B>0
B
Q
1
Q
2
Q
3
n=20
n=50
g
3
Similarly, the whiskers may be used for judging symmetry and negative skewness.
