Temperature-Entropy Diagram for Water
Temperature-Entropy Diagram for Water


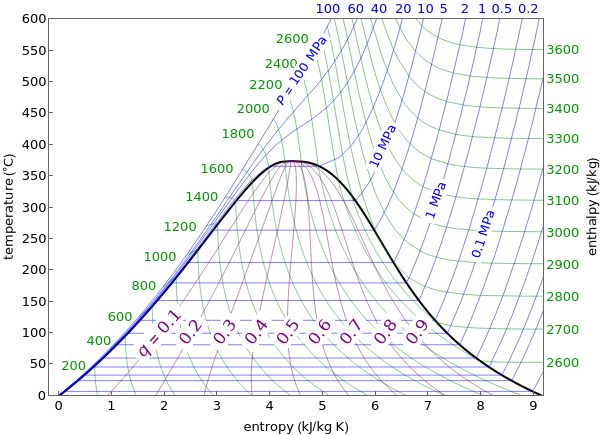
This Demonstration shows a temperature-entropy () diagram for water. Use the checkboxes to add or remove a property from the diagram. You can show lines of constant enthalpy (green), pressure (blue) and quality (mass% vapor, purple). Check "phase envelope" to view the saturated liquid (magenta) and saturated vapor (orange) curves and the location of the critical point. Check "grid lines" to display grid lines.
T-S
Details
Details
See [2] for more information on how to read a diagram.
T-S
References
References
External Links
External Links
Permanent Citation
Permanent Citation
Adam J. Johnston, Rachael L. Baumann, John L. Falconer
"Temperature-Entropy Diagram for Water"
http://demonstrations.wolfram.com/TemperatureEntropyDiagramForWater/
Wolfram Demonstrations Project
Published: August 12, 2016