Is there a problem with TradingChart[]?
I ask for the data on GOOG as follows: The table has Date,Open,High,Low,Close,Volume and consists of 7 bars, as shown in the output.
I ask for the data on GOOG as follows: The table has Date,Open,High,Low,Close,Volume and consists of 7 bars, as shown in the output.
In[]:=
data=Dataset[FinancialData["GOOG","OHLCV",{{2014,3,1},{2014,9,30},"Month"}]["DatePath"]];data
Out[]=
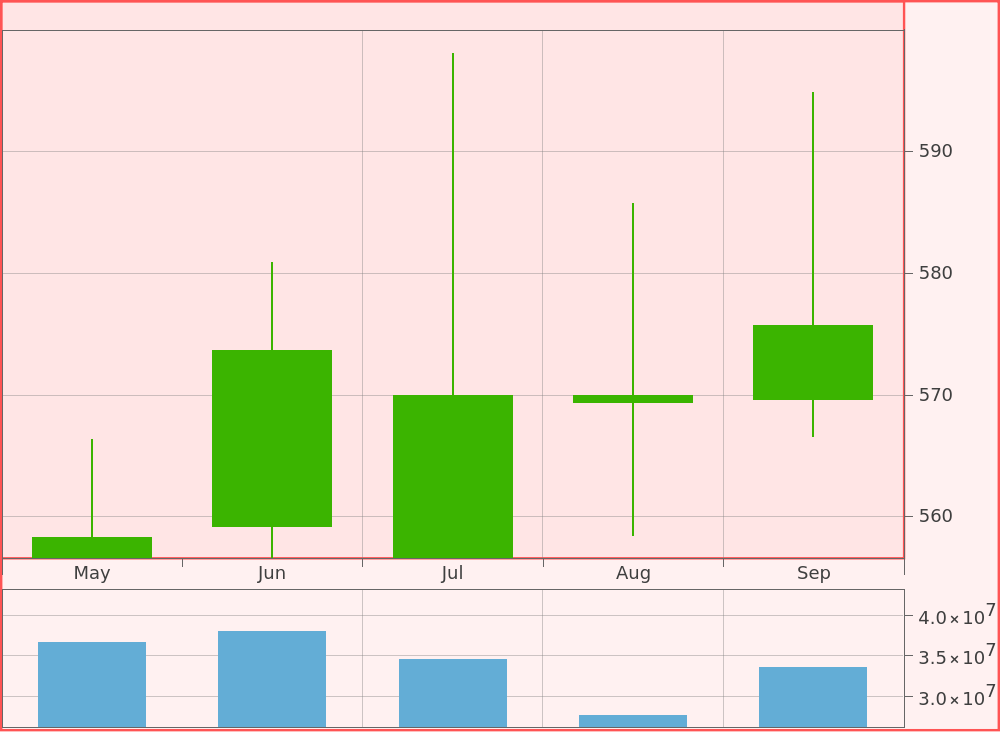
I then look for “Valleys” in the data among the first 7 bars. So I use InteractiveTradingChart or TradingChart (see below) and make sure that in the InteractiveChart you cover the whole range (made up of the 7 bars)
In[]:=
InteractiveTradingChart[data]TradingChart[data]
Out[]=



Out[]=
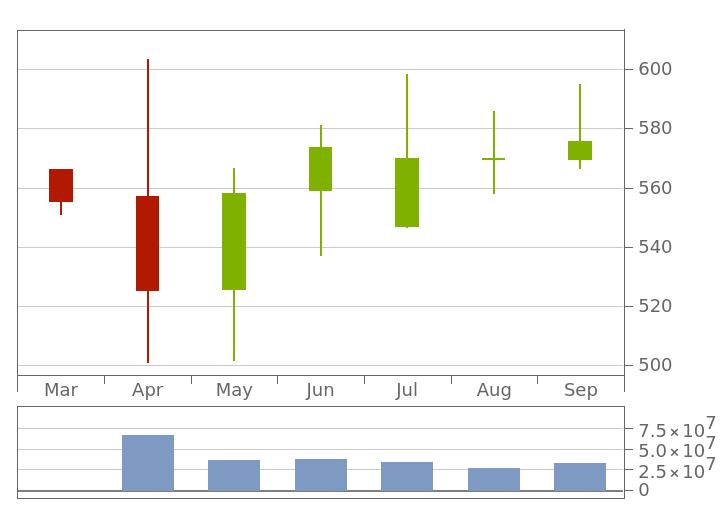
The interesting thing is that my algorithm, which finds all the Elliott Waves in a stock, called for a Valley at Candlestick #6. My problem is that when I look at Candlestick #6 in the charts it doesn’t look like a valley since its low is not lower than the 2 other surrounding lows (Bars #5 and #7). My definition of a Valley at Bar X is that:
Low of Bar[[x-1]] > Low of Bar[x] < Low of Bar[[x+1]] (I don’t use the FindPeaks of Mathematica)
So, when my code was saying that it found a low at Bar #6 I thought I had a bug in my code. But I looked at it and it was correct as it was finding other lows correctly.
So, I decided to look at the lows displayed in the table above. There we have:
Low of Bar #5 = $563.46
Low of Bar #6 = $558.47
Low of Bar #7 = $566.66
Check it out below.
In[]:=
#[[2]][[3]]&/@data[5;;7]
Out[]=
Looking at the raw data, it is clear that INDEED Bar#6 is a Valley since the low of Bar #6, at $558.57 is lower than the 2 adjacent lows: Bar #5 at $563.46 and Bar #7 at $566.66
So my question is: Is there a BUG in TradingChart (and InteractiveTradingChart} functions? On the charts it shows that the low of Bar #5 is below $558 (Graphically), yet the data in the table states that the low at Bar #5 is $563.46 (which is above the low of Bar #6). The FinancialData[] output says one thing, but the charts say something else.
Has anybody else seen this?
I also noticed that for Bar#5, looking at the table, the Open of Bar#5 is $546.82 which strangely enough is lower than its low (stated to be $563.46). Perhaps that is why the charts show a low for Bar #5 of $546.82. Perhaps this is an issue of uncurated data.