There are many algorithms for diagnosing chaos. The most famous are Lyapunov exponent and correlation dimension. But they require a lot of computation and knowledge of many details. By chance I found a rather old article that suggests effective and a well thought-out chaos analysis method, which returns the result in 0-1 format. Although the idea of describing chaos by one number is a bit speculative, it can be useful for a rough evaluation of various processes' behavior . This algorithm is perfectly implemented in the Wolfram Language as short fast code (and I’m sure it can still be optimized).
Short theory
Short theory
Authors consider the sequences of sums (n)=sin(jc) and (n) = cos(jc), where , 1 ≤ j ≤ N are observations data and 0 < c < π - some parameter. In fact this is kind of AnglePath. Then calculate mean square displacement (n)=1/N+ for a large number n, but still n ≪ N. By the slope of the plot one can already get an idea of the degree of data chaos.But the authors recommend performing additional calculations, obtaining a normalized value of 0 < < 1, where 0 is for absolutely regular (e.g., periodic) and 1 is for completely random data. In general, the method is a synthesis of spectral analysis and evaluation of random walks.Parameter c can be considered a resonance frequency. Pseudo-random observations can show resonances at certain frequencies giving small , so the final result is a median of values of for different c.
p
c
n
∑
j=1
ϕ
j
q
c
n
∑
j=1
ϕ
j
ϕ
j
M
c
N
∑
j=1
2
((j+n)-(j))
p
c
p
c
2
((j+n)-(j))
q
c
q
c
M
c
K
c
K
c
~
2
10
K
c
Main code
Main code
Literal implementation of the article's algorithm, using cool built-ins. κ stands for c in paper, ν = /Nand chaosValue is itself.
n
max
K
c
Clear[chaosValue,safeCorr];(*Thedatamayaccidentallybeaconstantarray,andthiscancauseanerrorinCorrelation*)safeCorr[x_,y_]:=With[{cov=Covariance[x,y],sd=StandardDeviation/@{x,y}},If[AnyTrue[sd,PossibleZeroQ],-1,cov/sd[[1]]/sd[[2]]]];chaosValue[data_,κ_,ν_:0.1]:=ModulelenData=Length@data,rngN=Range@(1+⌈νLength@data⌉),μ=(1-Cos@κ),pq,pq=Rest@Block[{i=0},FoldList[(i++;{#1[[1]]+#2Sin[κi],#1[[2]]+#2Cos[κi]})&,{0,0},data]];safeCorr[rngN,Total[Flatten[pq[[;;lenData-#]]-pq[[#+1;;lenData]]]^2]/lenData-μ(1-Cos[#κ])&/@rngN];
2
(Mean@data)
Simple 0 - 1 test
Simple 0 - 1 test
The authors propose to select ~100 samples for κ in the range π/5 < κ < 4π/5 and take median of all . We will need more detailed data, so the following code provides settings:
K
c
In[]:=
Clear[chaosTestList];chaosTestList[data_,ν_:0.1,mn_:π/5,mx_:4π/5.,nums_:100]:=ParallelTable[chaosValue[data,κ,ν],{κ,Subdivide[mn,mx,nums]}];
Classic example
Classic example
Clear[logGen];logGen[p_,num_:2000]:=NestList[p#(1-#)&,RandomReal[],num];
Very desirable to perform parallel computations (in accordance with your hardware)
In[]:=
LaunchKernels[];
Build a plot of medians chaosTestList for different logistic map parameters. For the specified parameters evaluation may take 15-20 sec. User can get more detailed picture, changing them.
In[]:=
logMedians=Block[{semps=Subdivide[3.5,4.,100],i=1},PrintTemporary[ProgressIndicator[Dynamic@i,{1,100}]];Table[i++;Median@chaosTestList@logGen@s,{s,semps}]];
Framed@ListLinePlot[logMedians,PlotLabel"Chaos test value for logistic map",AxesLabel{"Map\n param","Median"},PlotStyle->Thickness@0.005,Mesh->All,MeshStyle->Directive[PointSize@0.01,Brown],PlotRange->{-0.5,1},DataRange{3.5,4.},ImageSize->300]
Out[]=
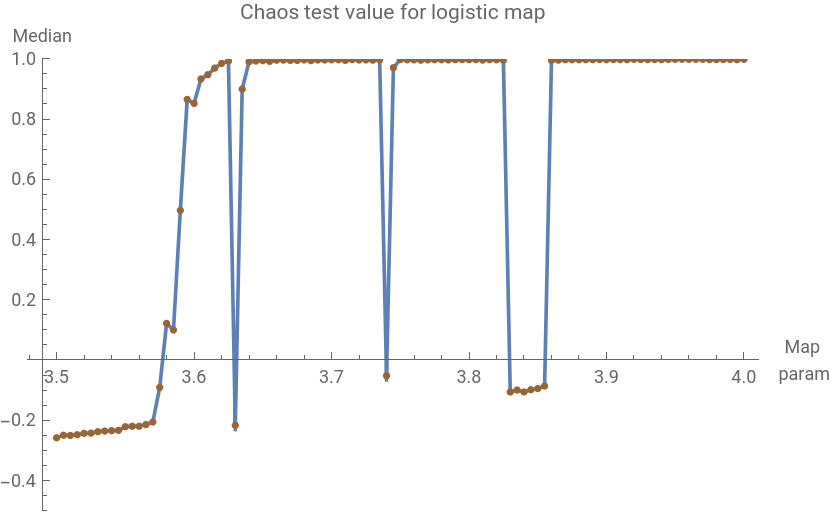
We see well known pattern of transition to randomness, with windows of stability within the area of chaos.
Generalization
Generalization
The medians disadvantage is low sensitivity at 0.9 < K < 1. Let's use Lehmer mod generator, which allows to get any degree of chaos.
In[]:=
Clear[modGen];modGen[p_,num_:4000]:=Standardize[N@NestList[Mod[Prime[p]#,Prime[p+13]]&,Prime[p+7],num]];
Compare the results of iterations for different prime modulo (and for built-in RandomReal). We use more samples of κ , 0 < κ < π and add value of interquartile range IQR.
modSeeds={84,212,420};modData=chaosTestList[#,0.1,1./600,π,600]&/@Append[modGen/@modSeeds,RandomReal[{-1,1},4000]];
In[]:=
modLbls=MapThread[Style[StringForm["p: ``, median: ``, IQR: ``",#1,Round[#2,.001],Round[#3,.002]],10,Brown,Bold]&,{Append[modSeeds,"rnd"],Median/@modData,InterquartileRange/@modData}];
In[]:=
Grid[Partition[MapThread[ListLinePlot[#1,PlotLabel#2,AxesLabel{"κ","K"},PlotStyle->Thickness@0.005,Mesh->All,MeshStyle->Directive[PointSize@0.01,Brown],PlotRange->{0.,1.},DataRange{0.,π},ImageSize->200]&,{modData,modLbls}],2],Frame->All]
Out[]=
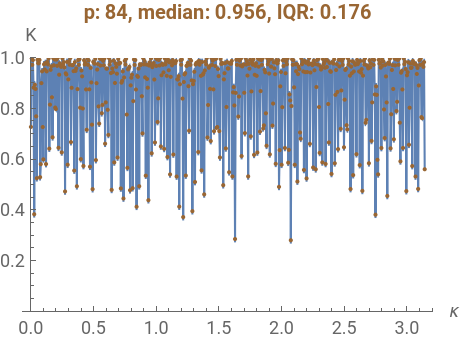
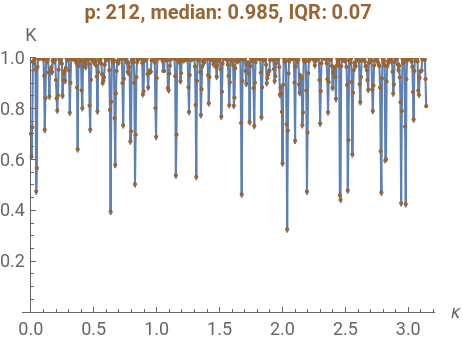
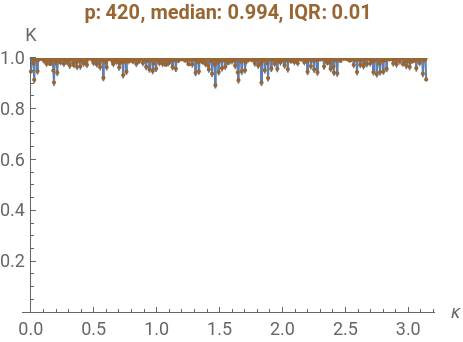
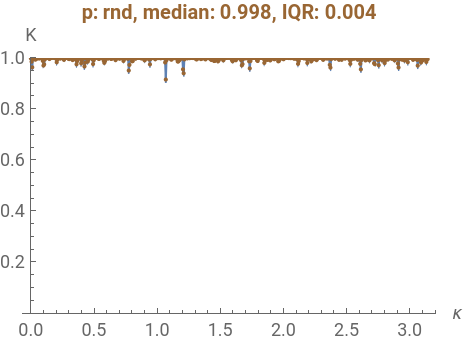
We see that the behaviour of generators is markedly different, resonances have various degrees of density and depth. Meanwhile, the final median values differ very little; but IQR values are much more indicative.
Substitution systems: the edge of chaos
Substitution systems: the edge of chaos
My favorite mathematical objects are substitution systems. I have described how to generate, select and display them here. Using the utilities from these notebooks and the test presented here, we will do a small study.
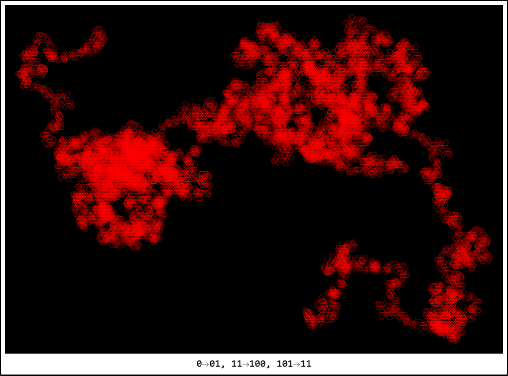
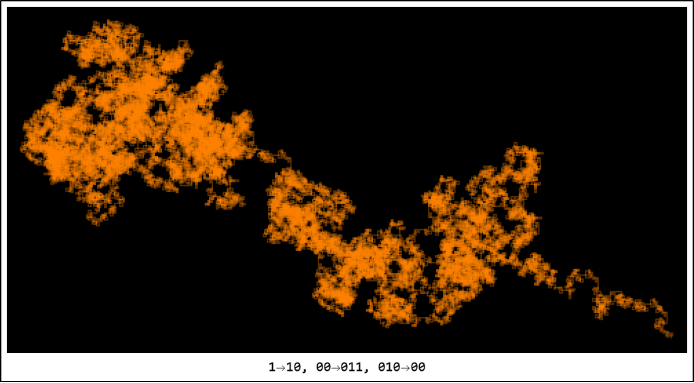
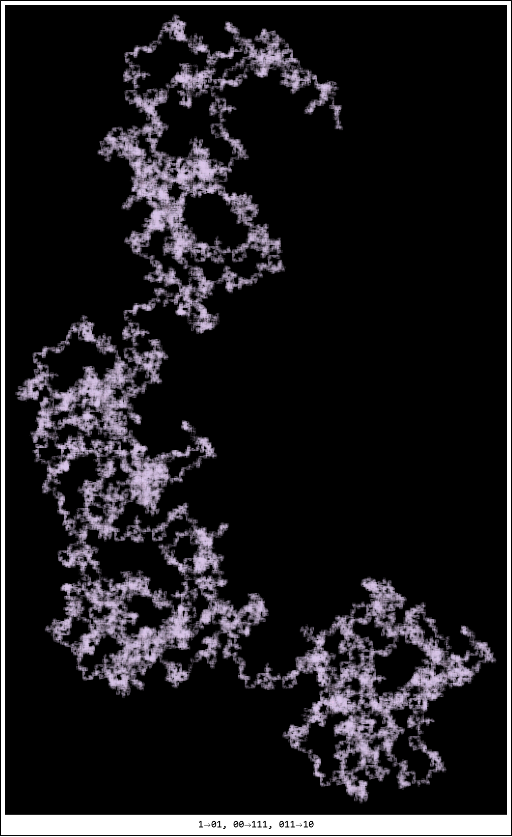
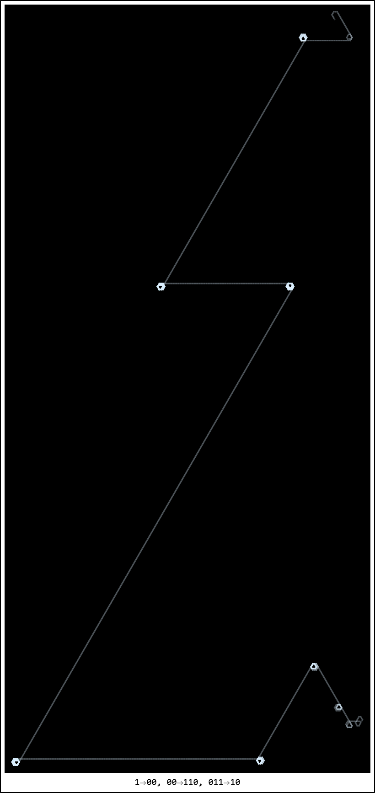
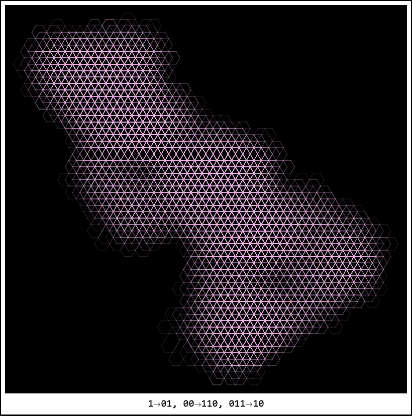
Consider the rule signature {{1, 2}, {2, 3}, {3, 2}}. Select the correct and non-periodic. They will be 2280. With chaos test we calculate medians and IQR of long enough generated sequences. At the beginning we will look at the candidates for the most chaotic:
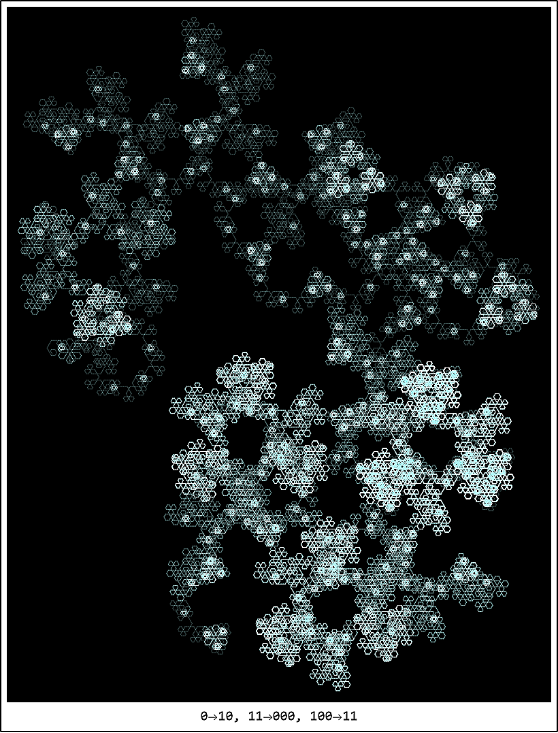
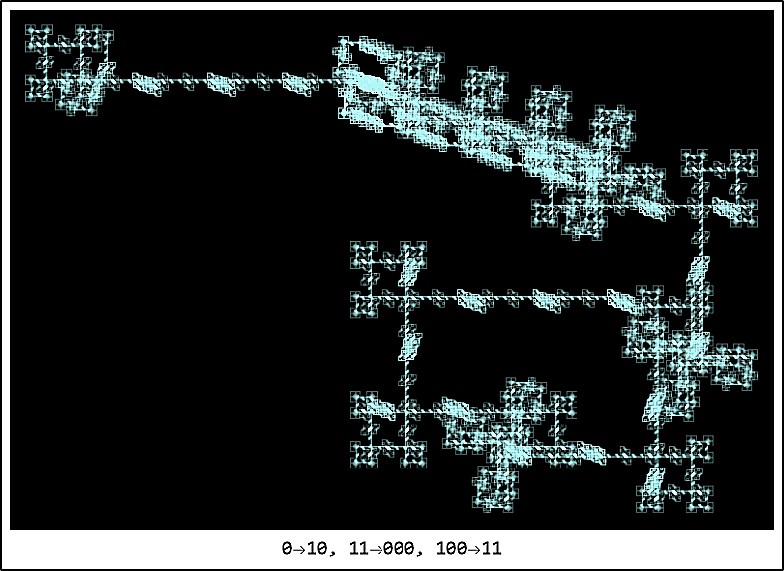
Turtle graphic for binary sequences generated by these rules are typical Rozy fractals: But we can pick rules with a smaller median value and a larger one - IQR. So we can find artifacts lying on the edge of chaos and exhibiting unusual behavior.Rule 100, 00110, 01110, median 0.878, IQR 0.102: (Levy flights)Rule 101, 00110, 01110, median 0.948, IQR 0.19: And finally, the most interesting thing I found this time. Rule 010, 11000, 10011, median 0.985, IQR 0.063, turtle graphics for π/3 and π/2:
CITE THIS NOTEBOOK
CITE THIS NOTEBOOK
Smart 0-1 chaos test: applications to modular generators, substitution rules, and Rozy fractals
by Denis Ivanov
Wolfram Community, STAFF PICKS, May 1, 2025
https://community.wolfram.com/groups/-/m/t/3453762
by Denis Ivanov
Wolfram Community, STAFF PICKS, May 1, 2025
https://community.wolfram.com/groups/-/m/t/3453762