Distribution of the Sample Range of Continuous Random Variables
Distribution of the Sample Range of Continuous Random Variables


Let , …, be a random sample from a continuous distribution. Let and be the smallest and the largest value in the sample. The sample range is , that is, the difference between the largest and the smallest value. The sample range is a crude measure of the variation in the sample. This Demonstration shows the distribution of the sample range when the sample is drawn from some well-known continuous distributions.
X
1
X
n
Y
1
Y
n
W
W=-
Y
n
Y
1
Details
Details
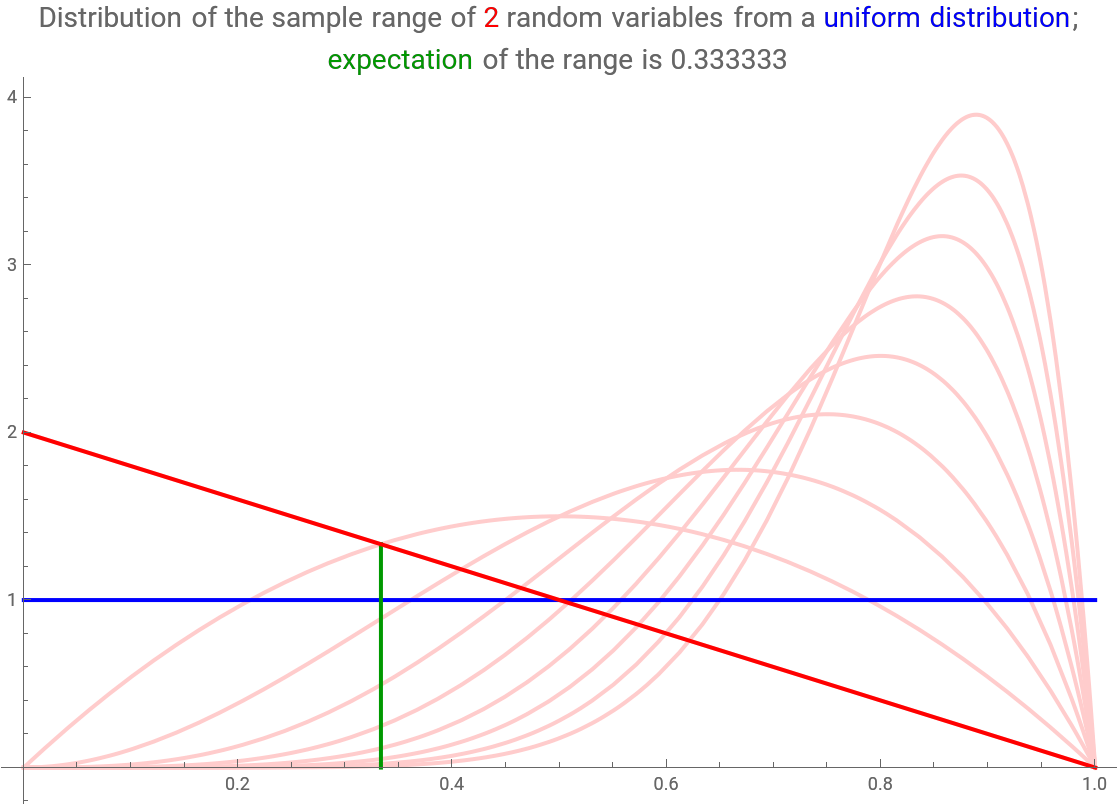
Snapshot 1: The sample is drawn from the standard uniform distribution; the blue line is the probability distribution function (PDF) of the uniform distribution. Each of the red curves is the PDF of a sample range: the dark red curve is the PDF of the sample range when there are only two observations. The light red curves are the PDFs of the sample range when there are 3–10 observations. The green vertical line is drawn at the expectation of the dark red PDF. When there are two observations from the uniform distribution, the sample range takes on small values close to zero with higher probability than large values close to one; the expectation is . For a sample of three observations, the range takes on, with high probability, intermediate values; the expectation is . For a sample of four observations, the expectation of the range is . On average, the more observations, the larger values the sample range takes on. For example, for a sample of 10 observations, the sample range takes on, with high probability, values from an interval of, say, ; the expectation is .
1/3
1/2
3/5
(0.5,1)
9/11
Snapshot 2: The sample is drawn from the exponential distribution with mean 1. The distribution of the sample range for two observations is the same as the original exponential distribution (the blue line is behind the dark red curve). For a sample of 10 observations, the sample range takes on, with high probability, values from an interval of, say, ; the expectation is 2.83.
(1,5)
Snapshot 3: The sample is drawn from the standard normal distribution. The distribution of the sample range for two observations takes on, with high probability, values from an interval of, say, ; the expectation is 1.13. For a sample of 10 observations, the sample range takes on, with high probability, values from an interval of, say, ; the expectation is 3.08.
(0,3)
(1.5,5)
The distributions considered in the Demonstration are as follows (as Mathematica input):
UniformDistribution[{0,1}]
BetaDistribution[2,1]
ExponentialDistribution[1]
GammaDistribution[2,1]
NormalDistribution[0,1]
LogisticDistribution[0,1]
ExtremeValueDistribution[0,1]
BetaDistribution[2,1]
ExponentialDistribution[1]
GammaDistribution[2,1]
NormalDistribution[0,1]
LogisticDistribution[0,1]
ExtremeValueDistribution[0,1]
Let the cumulative distribution function (CDF) and the probability density function (PDF) of the sample variable be and , respectively. The CDF of the sample range for a sample of size is[1, p. 31]
X
F(x)
f(x)
W
n
F
W
∞
∫
-∞
n-1
[F(x+w)-F(x)]
This formula was used to derive the CDFs in the Demonstration (the variable in the code). The PDFs (the variable in the code) are derived by differentiating the CDFs. However, for the normal distribution, the integral in (w) cannot be calculated, and so we approximated the CDFs of the sample range with interpolating functions (FunctionInterpolation). The PDFs were then calculated by differentiating the interpolating functions; the code of the Demonstration contains the resulting interpolating functions in InputForm.
F
f
F
W
The expectations were calculated exactly in the usual way (the exact values can be found from the code; in the Demonstration, we only show the decimal values). However, for the expectations of the normal distribution, we only calculated approximate decimal values by using the interpolating functions and NIntegrate.
References
References
[1] B. C. Arnold, N. Balakrishnan, and H. N. Nagaraja, A First Course in Order Statistics, Philadelphia: SIAM, 2008.
External Links
External Links
Permanent Citation
Permanent Citation
Heikki Ruskeepää
"Distribution of the Sample Range of Continuous Random Variables"
http://demonstrations.wolfram.com/DistributionOfTheSampleRangeOfContinuousRandomVariables/
Wolfram Demonstrations Project
Published: June 24, 2014