Variables and other parameters are the same as the original post. I only included some minor changes to study the new data of Iran.
Data processing (as of 2:12pm PT 3/4/2020)
Data processing (as of 2:12pm PT 3/4/2020)
In[]:=
iranData=Normal[ds0[GroupBy["Country"]]["Iran"]][[1,3;;]];
A few hrs ago, Iran health ministry announced 586 new confirmed cases, 15 new deaths, and and overall recovered cases of 552.
In[]:=
confirmedTS=TimeSeriesInsert[iranData["ConfirmedCases"],{Today,iranData["ConfirmedCases"]["LastValue"]+586}];
In[]:=
deathsTS=TimeSeriesInsert[iranData["Deaths"],{Today,iranData["Deaths"]["LastValue"]+15}];
In[]:=
recoveredTS=TimeSeriesInsert[iranData["RecoveredCases"],{Today,552}];
Take the top 5 countries with largest number of COVID19 deaths:
In[]:=
top=ds0[GroupBy["Country"],Total,{"ConfirmedCases","Deaths"}][TakeLargestBy[#Deaths["LastValue"]&,4]];
In[]:=
top=ReplacePart[top,{{"Iran","ConfirmedCases"}confirmedTS,{"Iran","Deaths"}deathsTS}];
Add the data of all countries and append it to the previous result:
In[]:=
PrependTo[top,"World"Normal@ds0[Total,{"ConfirmedCases","Deaths"}]];
Divide Deaths by ConfirmedCases, to get the case-fatality ratio:
In[]:=
ratioData=#2/#1&@@@Normal[Values[Values[top]]]/.IndeterminateNone//Quiet;
Box-and-Whisker summary of distributions
Box-and-Whisker summary of distributions
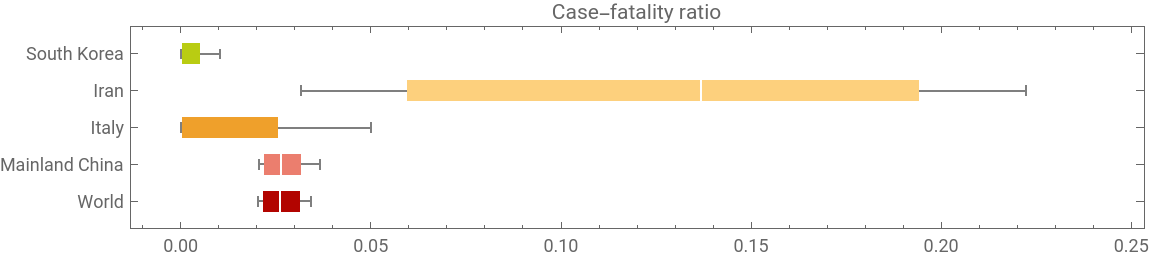
Make a box-and-whisker chart for the case-fatality ratios:
In[]:=
BoxWhiskerChart[N[Values/@ratioData],"Outliers",ChartLabelsPlaced[Normal@Keys[top],Axis],ChartStyle10,BarOriginLeft,PlotRange{{0,.24},All},AspectRatio1/5,ImageSizeLarge,PlotLabel"Case-fatality ratio"]
Out[]=
In[]:=
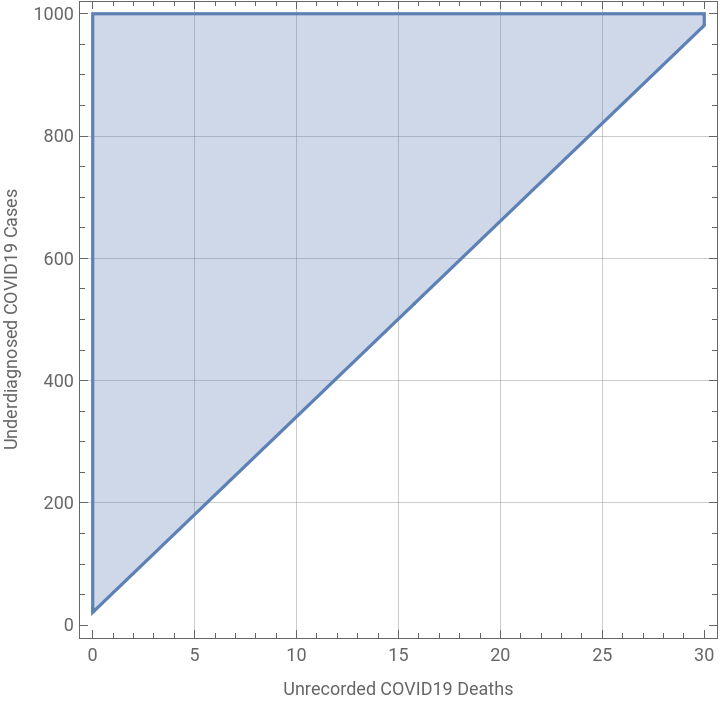
RegionPlot[Quantile[,0.25]≤correction≤Quantile[,0.75]&&y≥x,{x,0,30},{y,0,1000},FrameLabel{"Unrecorded COVID19 Deaths","Underdiagnosed COVID19 Cases"},GridLinesAutomatic]
Out[]=