Critical Value z* for z-Scores for Confidence Levels
Critical Value z* for z-Scores for Confidence Levels


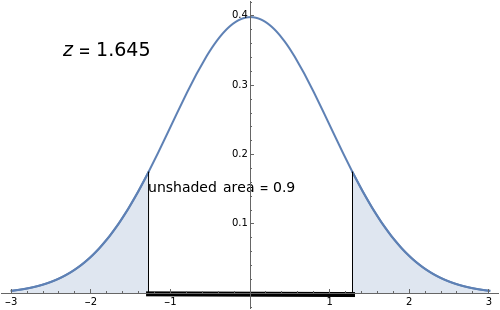
This Demonstration explains how a -score (a critical -score) is related to confidence levels and used for the traditional method of significance tests[1]. As you move the slider, the confidence level changes, and in turn the area as well as the -score changes.
*
z
z
*
z
The critical value is calculated by using a confidence level and finding the tail area of one side, and then taking the inverse of the cumulative distribution function of that area to get . A confidence interval is a range that is calculated using the sample mean and the population standard deviation. If many samples are taken and many intervals are created, of the resulting intervals will contain the true population mean, where is the chosen confidence level (for example, 99%).
*
z
*
z
x%
x
Details
Details
This was a project for Advanced Topics in Mathematics II, 2016–2017, Torrey Pines High School, San Diego, CA.
References
References
[1] Armstrong State University, Department of Mathematics. "Critical Values of ." (Apr 28, 2017) www.math.armstrong.edu/statsonline/5/5.3.2.html.
z
[1] “InverseCDF” from Wolfram Language Documentation—A Wolfram Web Resource. reference.wolfram.com/language/ref/InverseCDF.html?q=InverseCDF.
[2] “NormalDistribution” from Wolfram Language Documentation—A Wolfram Web Resource. reference.wolfram.com/language/ref/NormalDistribution.html?q=NormalDistribution.
Permanent Citation
Permanent Citation
Emily Hou, Esha Madhekar
"Critical Value z* for z-Scores for Confidence Levels"
http://demonstrations.wolfram.com/CriticalValueZForZScoresForConfidenceLevels/
Wolfram Demonstrations Project
Published: May 1, 2017