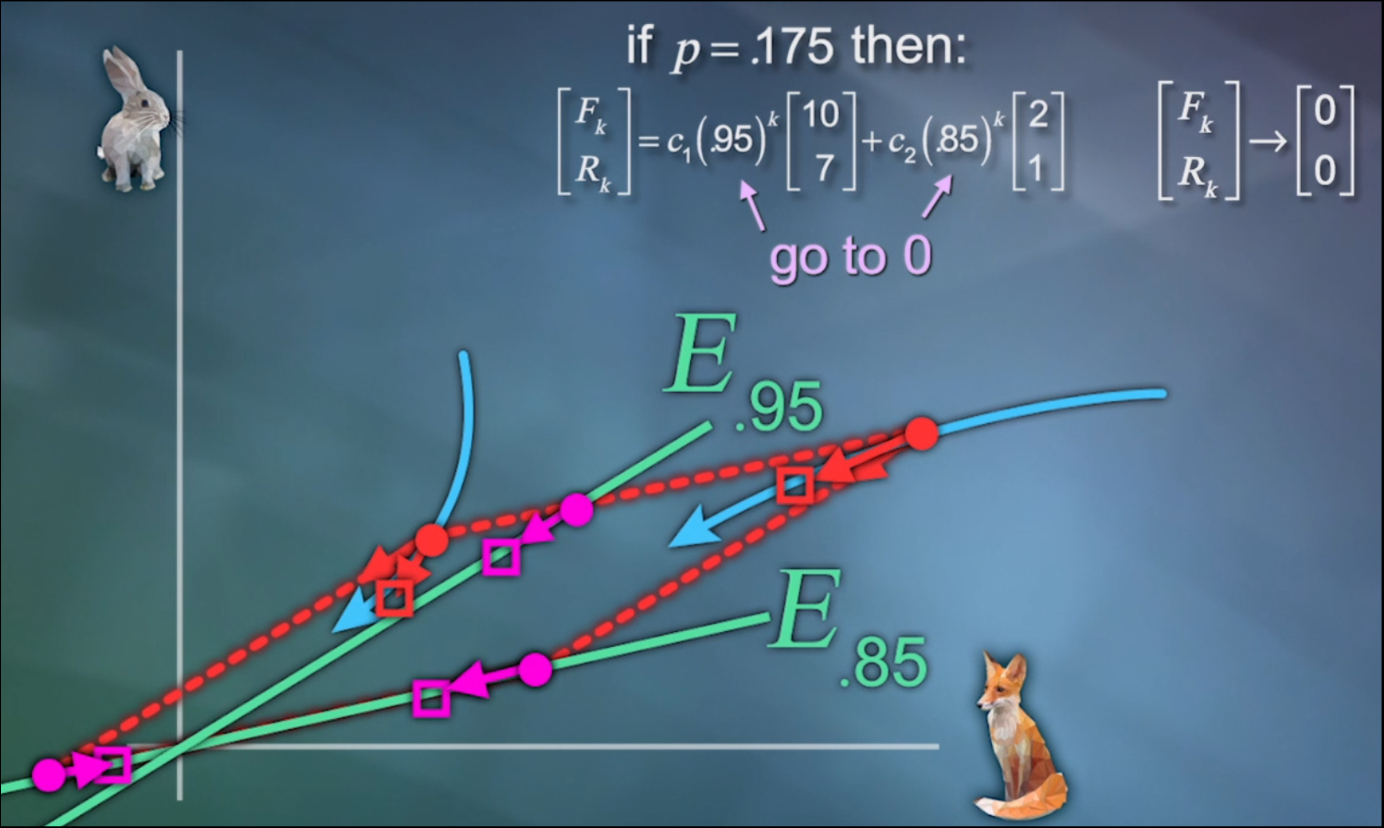
I am trying to plot how the below Predictor / Prey Model changes over time (where time is represented by the superscript k in the calculations below.
Background:
Background:
Predictor / Prey Model: = .6 + .5 = - 0.175 + 1.2
F
n+1
F
n
R
n
R
n+1
F
n
R
n
In[]:=
Eigenvalues[{{.6,.5},{-.175,1.2}}]
Out[]=
{0.95,0.85}
In[]:=
Eigenvectors,,-,
6
10
1
2
7
40
6
5
Out[]=
,1,{2,1}
10
7
F k |
R k |
c
1
k
0.95)
10 |
7 |
c
2
k
(0.85)
2 |
1 |
Calculation:
Calculation:
Since I am dealing with population changes over each time period, I figured that ParametricPlot would be the best choice of function.
I am not sure but am assuming that I should get a plot of the two E-lines similar to the one below, without the red or blue graphics.
I am not sure but am assuming that I should get a plot of the two E-lines similar to the one below, without the red or blue graphics.
In[]:=
ParametricPlot[{10,7}.{f,r}+{2,1}.{f,r},{k,1,10}]/.{->1,->1}
c
1
k
0.95
c
2
k
0.85
c
1
c
2
Out[]=