The Ministry of Land, Infrastructure, Transport and Tourism (MLIT) publishes a data of the trends in land value in Tokyo from 1983 to 2025. I have therefore visualized the land values in about 1,600 locations in the 23 wards of Tokyo over a period of 43 years in the Wolfram language.
Import data
Import data
The published data is in the GeoJSON format. Get the data in the GeoJSON file, interpreted as Wolfram Language expressions.
data=Import["L01-25_13.geojson","Data"];
The data contains a lot of data that is not needed for visualisation and only the necessary data is extracted to make the Tabular object.
Data cleaning
Data cleaning
Tabular format
Tabular format
In[]:=
tab=
Out[]=
Tabular


The number of the locations in the 23 wards of Tokyo is 1,567.
In[]:=
Length@tab
Out[]=
1567
It can be stored in less memory space than the original.
In[]:=
ByteCount@dataByteCount@tab
Out[]=
48619608
Out[]=
735904
Quick insights
Quick insights
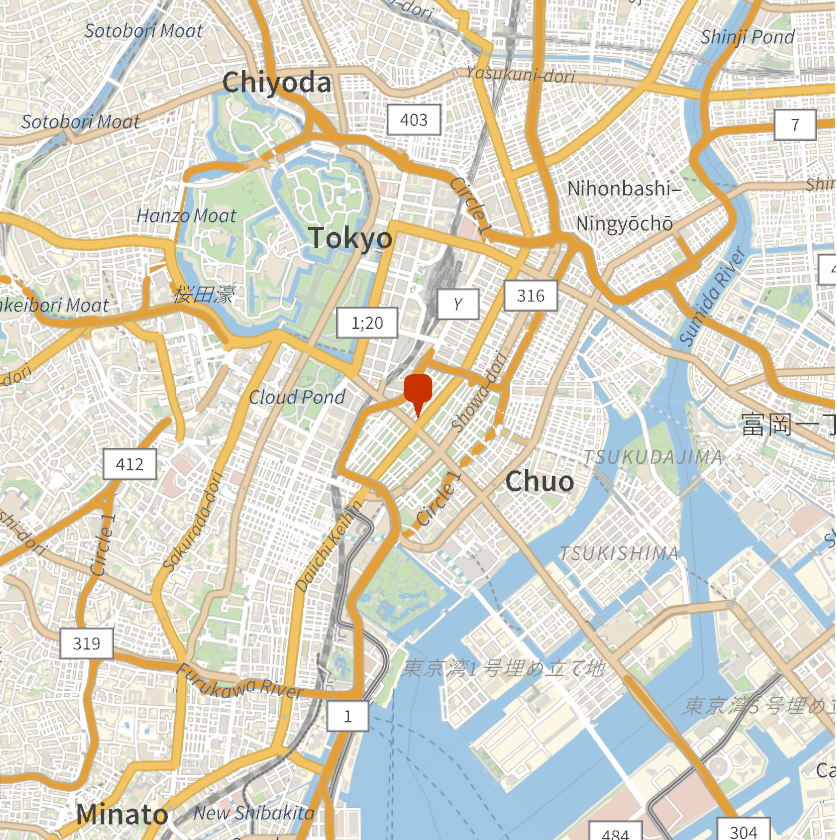
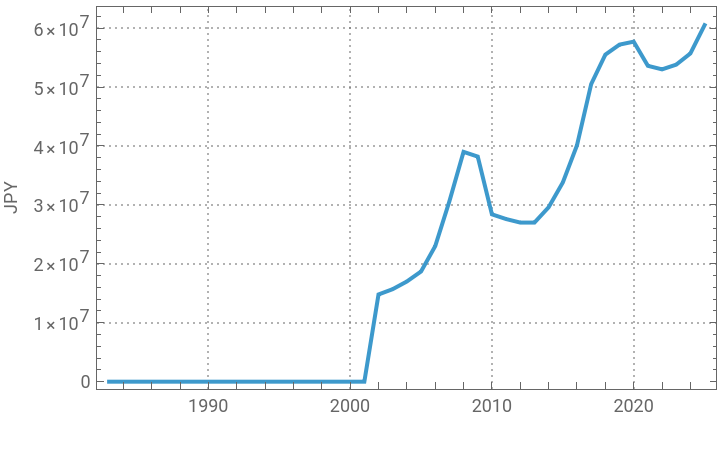
The highest land price per square metre in 2025 was 60,500,000 JPY(418660 USD). It is 4-2-4 Ginza Chuo-ku, Tokyo.
In[]:=
highest2025=Normal@TakeLargestBy[tab,"2025",1][[1]];maxlandvalue=highest2025["2025"]maxlandvalue*FinancialData["JPY/USD"]
Out[]=
60500000
Out[]=
418660.
In[]:=
GeoGraphics[GeoMarker@highest2025["coordinate"],GeoRange->Quantity[2,"Miles"]]
Out[]=
Check the change in this land values from 1983 to 2025.
In[]:=
DateListPlot[highest2025[[2;;]],PlotTheme->"Detailed",FrameLabel->{"","JPY"}]
Out[]=
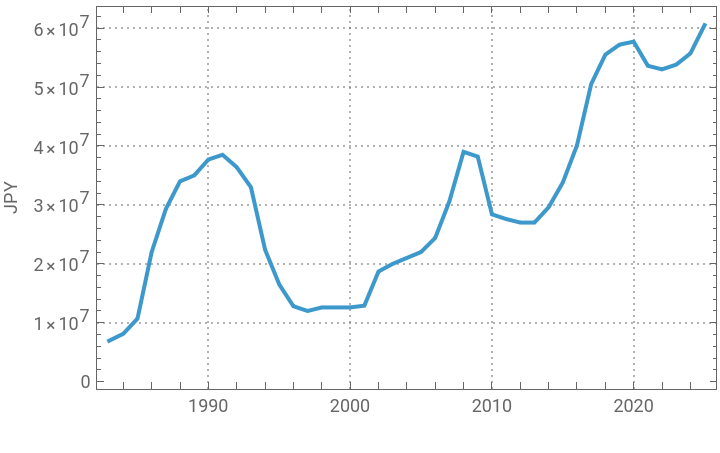
Check the change in the highest land value in each year.
In[]:=
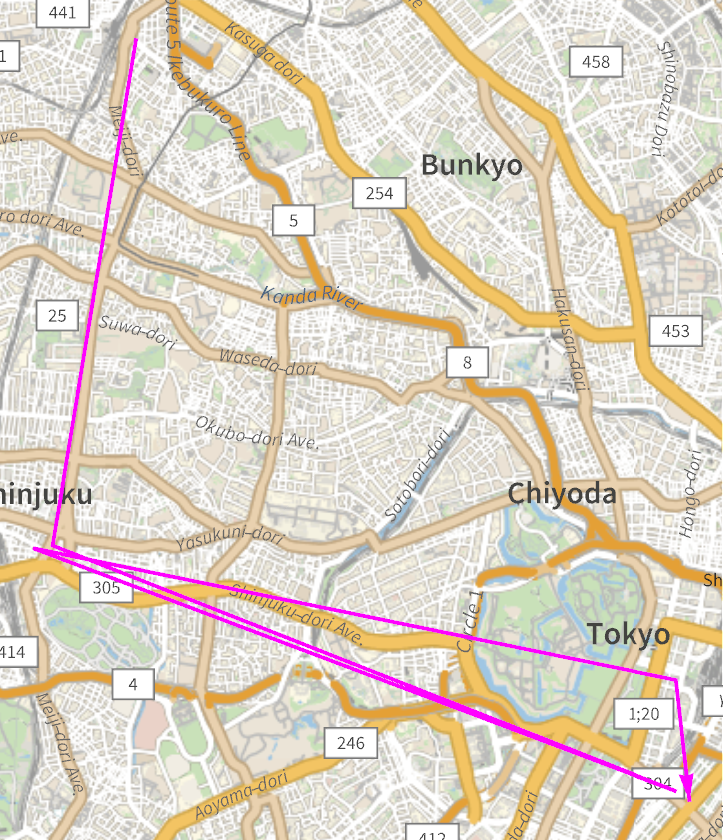
highest[year_]:=Block[{select,coordinate,landvalue},select=Normal@TakeLargestBy[tab,year,1][[1]];coordinate=select["coordinate"];landvalue=select[year];{year,landvalue,coordinate,landvalue}];list=highest/@ToString/@Range[1983,2025];
In[]:=
DateListPlot[list[[All,1;;2]],PlotTheme->"Detailed",FrameLabel->{"","JPY"}]
Out[]=
In[]:=
GeoGraphics[{Magenta,Thick,Arrow[GeoPath[list[[All,3]]]]}]
Out[]=
Visualize the land values
Visualize the land values
Visualize the land values in 1,567 locations in the 23 wards of Tokyo over a period of 43 years.
Get the range of latitude and longitude of all locations.
In[]:=
{lat,lon}=MinMax/@Transpose@Normal@tab[All,"coordinate"]
Out[]=
{{35.5435,35.8141},{139.57005190000007,139.91463810000005}}
Get the geographical image of the 23 wards of Tokyo.
In[]:=
GeoGraphics[GeoRange{lat,lon},GeoBackground->"VectorDark"];map=Rasterize[%,ImageResolution200]
Out[]=
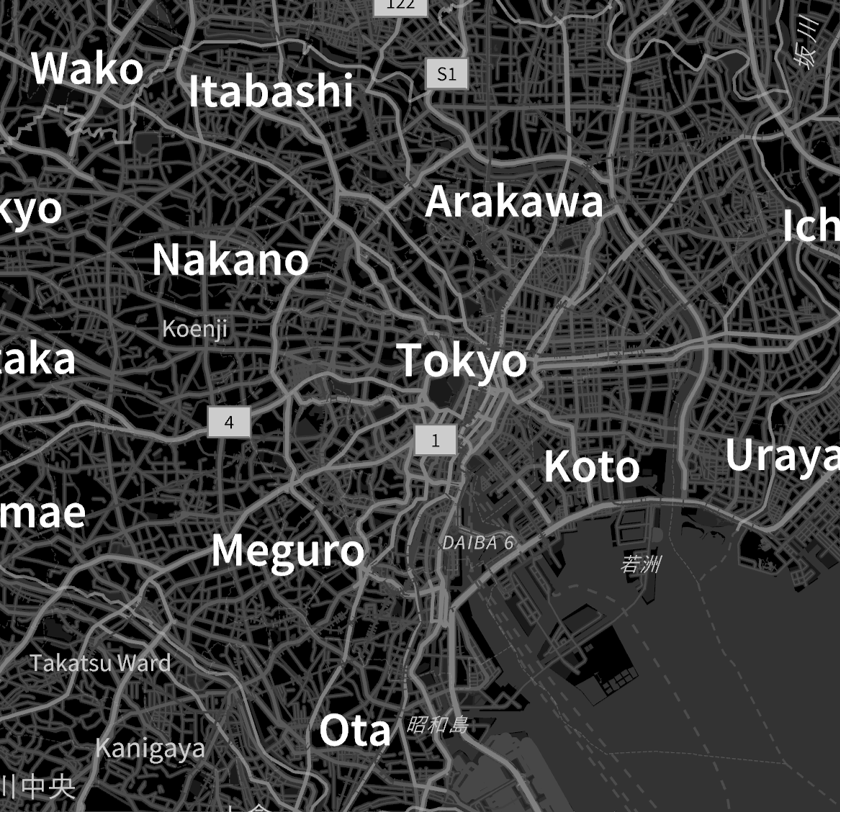
Transform the image into three dimensions.
Make colors, ColorFunction and legend.
Define the function to show land values on the map.
The land values in 2025 is as follows.
The animation of the land values from 1983 to 2025 is as follows.
CITE THIS NOTEBOOK
CITE THIS NOTEBOOK
Visualizing the land values in Tokyo
by Kotaro Okazaki
Wolfram Community, STAFF PICKS, April 10, 2025
https://community.wolfram.com/groups/-/m/t/3442449
by Kotaro Okazaki
Wolfram Community, STAFF PICKS, April 10, 2025
https://community.wolfram.com/groups/-/m/t/3442449