A Crash Course in Data Visualization
with Wolfram Language
A Crash Course in Data Visualization
with Wolfram Language
with Wolfram Language
Phileas Dazeley-Gaist - Wolfram Research
(Cornell: College of Human Ecology, 2025)
(Cornell: College of Human Ecology, 2025)
Getting set up: Installing Wolfram at Cornell
Getting set up: Installing Wolfram at Cornell
1
.Head to www.wolfram.com/siteinfo
2
.Enter your Cornell email address in the input field
3
.Download and install the Wolfram App
4
.Create a Wolfram account with your institutional email address, and log into the Wolfram app using your account
Teasers
Teasers
Here are a few example WL programs that with visual outputs.
By the end of this presentation you’ll have new intuitions about how these programs achieve what they do, even if you won’t necessarily know how to reproduce everything you’ll have seen.
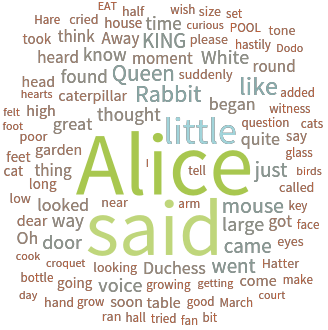
Make a word from words in Alice in Wonderland:
WordCloud[ExampleData[{"Text","AliceInWonderland"}],ColorFunction->"IslandColors"]
Out[]=
Plot 3 random walks:
ListLinePlotTable[Accumulate[RandomReal[{-1,1},50]],3],
Out[]=

Color every cell in a matrix differently according to its position:
In[]:=
MapIndexed[Highlighted[#1,Background->Blend[(ColorData[10]/@#2)]]&,ConstantArray[" ",{10,10}],{2}]//MatrixForm
Out[]//MatrixForm=
Produce a Sierpiński gasket using text:
In[]:=
NestList[Subsuperscript[#,#,#]&,o,6]
Out[]=
o,,,,,,
o
o
o
o
o
o
o
o
o
o
o
o
o
o
o
o
o
o
o
o
o
o
o
o
o
o
o
o
o
o
o
o
o
o
o
o
o
o
o
o
o
o
o
o
o
o
o
o
o
o
o
o
o
o
o
o
o
o
o
o
o
o
o
o
o
o
o
o
o
o
o
o
o
o
o
o
o
o
o
o
o
o
o
o
o
o
o
o
o
o
o
o
o
o
o
o
o
o
o
o
o
o
o
o
o
o
o
o
o
o
o
o
o
o
o
o
o
o
o
o
o
o
o
o
o
o
o
o
o
o
o
o
o
o
o
o
o
o
o
o
o
o
o
o
o
o
o
o
o
o
o
o
o
o
o
o
o
o
o
o
o
o
o
o
o
o
o
o
o
o
o
o
o
o
o
o
o
o
o
o
o
o
o
o
o
o
o
o
o
o
o
o
o
o
o
o
o
o
o
o
o
o
o
o
o
o
o
o
o
o
o
o
o
o
o
o
o
o
o
o
o
o
o
o
o
o
o
o
o
o
o
o
o
o
o
o
o
o
o
o
o
o
o
o
o
o
o
o
o
o
o
o
o
o
o
o
o
o
o
o
o
o
o
o
o
o
o
o
o
o
o
o
o
o
o
o
o
o
o
o
o
o
o
o
o
o
o
o
o
o
o
o
o
o
o
o
o
o
o
o
o
o
o
o
o
o
o
o
o
o
o
o
o
o
o
o
o
o
o
o
o
o
o
o
o
o
o
o
o
o
o
o
o
o
o
o
o
o
o
o
o
o
o
o
o
o
o
o
o
o
o
o
o
o
o
o
o
o
o
o
o
o
o
o
o
o
o
o
o
o
o
o
o
o
o
o
o
o
o
o
o
o
o
o
o
o
o
o
o
o
o
o
o
o
o
o
o
o
o
o
o
o
o
o
o
o
o
o
o
o
o
o
o
o
o
o
o
o
o
o
o
o
o
o
o
o
o
o
o
o
o
o
o
o
o
o
o
o
o
o
o
o
o
o
o
o
o
o
o
o
o
o
o
o
o
o
o
o
o
o
o
o
o
o
o
o
o
o
o
o
o
o
o
o
o
o
o
o
o
o
o
o
o
o
o
o
o
o
o
o
o
o
o
o
o
o
o
o
o
o
o
o
o
o
o
o
o
o
o
o
o
o
o
o
o
o
o
o
o
o
o
o
o
o
o
o
o
o
o
o
o
o
o
o
o
o
o
o
o
o
o
o
o
o
o
o
o
o
o
o
o
o
o
o
o
o
o
o
o
o
o
o
o
o
o
o
o
o
o
o
o
o
o
o
o
o
o
o
o
o
o
o
o
o
o
o
o
o
o
o
o
o
o
o
o
o
o
o
o
o
o
o
o
o
o
o
o
o
o
o
o
o
o
o
o
o
o
o
o
o
o
o
o
o
o
o
o
o
o
o
o
o
o
o
o
o
o
o
o
o
o
o
o
o
o
o
o
o
o
o
o
o
o
o
o
o
o
o
o
o
o
o
o
o
o
o
o
o
o
o
o
o
o
o
o
o
o
o
o
o
o
o
o
o
o
o
o
o
o
o
o
o
o
o
o
o
o
o
o
o
o
o
o
o
o
o
o
o
o
o
o
o
o
o
o
o
o
o
o
o
o
o
o
o
o
o
o
o
o
o
o
o
o
o
o
o
o
o
o
o
o
o
o
o
o
o
o
o
o
o
o
o
o
o
o
o
o
o
o
o
o
o
o
o
o
o
o
o
o
o
o
o
o
o
o
o
o
o
o
o
o
o
o
o
o
o
o
o
o
o
o
o
o
o
o
o
o
o
o
o
o
o
o
o
o
o
o
o
o
o
o
o
o
o
o
o
o
o
o
o
o
o
o
o
o
o
o
o
o
o
o
o
o
o
o
o
o
o
o
o
o
o
o
o
o
o
o
o
o
o
o
o
o
o
o
o
o
o
o
o
o
o
o
o
o
o
o
o
o
o
o
o
o
o
o
o
o
o
o
o
o
o
o
o
o
o
o
o
o
o
o
o
o
o
o
o
o
o
o
o
o
o
o
o
o
o
o
o
o
o
o
o
o
o
o
o
o
o
o
o
o
o
o
o
o
o
o
o
o
o
o
o
o
o
o
o
o
o
o
o
o
o
o
o
o
o
o
o
o
o
o
o
o
o
o
o
o
o
o
o
o
o
o
o
o
o
o
o
o
o
o
o
o
o
o
o
o
o
o
o
o
o
o
o
o
o
o
o
o
o
o
o
o
o
o
o
o
o
o
o
o
o
o
o
o
o
o
o
o
o
o
o
o
o
o
o
o
o
o
o
o
o
o
o
o
o
o
o
o
o
o
o
o
o
o
o
o
o
o
o
o
o
o
o
o
o
o
o
o
o
o
o
o
o
o
o
o
o
o
o
o
o
o
o
o
o
o
o
o
o
o
o
o
o
o
o
o
o
o
o
o
o
o
o
o
o
o
o
o
o
o
o
Make a list of connections between a selection of European capital cities and Rome:
In[]:=
romeCityConnections=ThreadDeleteCasesEntityValueVertexListNestGraph#1&,,2,"CapitalCity",
Out[]=
,,,,,,,,,,,,,,,,
Illustrate the saying: “All roads lead to Rome” with a map of driving directions from a selection of European Capitals to Rome:
Construct a 4-hop graph of word synonyms starting from the root node “bug”:
Wolfram Language ABCs
Wolfram Language ABCs
Before we get into data visualisation techniques with Wolfram Language, here are a few keys you’ll need to understand how to read Wolfram Language code.
A few warnings before we jump in:
Wolfram Language is not a programming language you ever fully learn. It’s just too big.
Don’t panic if you don’t immediately understand something. Programming always looks a little mysterious until you try it out, but it’s really not too bad.
I’ll send you this notebook later, so you’ll be able to review all the code, copy and paste examples, and mess about with it on your own time.
Please feel free to jump in to ask me questions. I’ll also take questions at the end of the talk.
Variable Assignment and Function Definitions
Variable Assignment and Function Definitions
Variable assignments allow you to define things by name and refer to them later.
Storing data (List, Association, Dataset, and Tabular)
Storing data (List, Association, Dataset, and Tabular)
Let’s walk through a few of the most common ways of storing data in Wolfram Language: lists, associations, datasets, and tabular objects:
*Plot* and *Chart* functions, and Graphics
*Plot* and *Chart* functions, and Graphics
Wolfram Language has a rich set of plotting functions that can handle everything from simple 2D plots to complex 3D graphics.
The Plot function
The Plot function
You can plot multiple functions at once by putting them in a list:
ListPlot and ListLinePlot
ListPlot and ListLinePlot
When you want to see relationships between variables, ListPlot can also be used to create scatter plots. Use Thread to pair up your lists of x and y values:
BarChart and PieChart
BarChart and PieChart
Histograms and Box-and-whisker plots
Histograms and Box-and-whisker plots
BoxWhiskerChart is great for comparing distributions across categories:
Plotting in 3D
Plotting in 3D
Define a list of images:
Make a feature space plot of the images, where similar images will be closer together, and more distinct images will be further apart:
Heat maps and matrix plots
Heat maps and matrix plots
Network plots
Network plots
Represent a fictional network of friends:
Word clouds
Word clouds
Geographic plots
Geographic plots
Produce a list of the 50 largest US cities by population:
Plot the locations of these cities:
There are many other plotting functions for geographic data, including GeoGraphics, GeoRegionValuePlot, GeoGraphPlot, and more.
Graphics
Graphics
Graphics creates graphics from primitives like points, lines, circles, and polygons. It’s the most general graphical visualization function in the language.
Example Graphics showing concentric circles:
Example Graphics showing off the main types of graphics primitives:
By combining different functions as building blocks, you can construct complex visualizations:
More involved examples
More involved examples
Other Plotting and Charting Functions
Other Plotting and Charting Functions
There are too many built in functions for data viz for me to cover in this short session. Just to give you an idea:
Giving big picture instructions (Bonus)
Giving big picture instructions (Bonus)
There are many built-in Wolfram Language functions that make the process of shaping and wrangling data, or performing sequences of actions.
These functions are often really useful when making data visualizations. We’ve come across a couple of them already in this presentation. Let’s see a few really common ones:
Maps (Map, MapApply, MapThread)
Maps (Map, MapApply, MapThread)
Nests (Nest, NestList, NestTree, NestGraph)
Nests (Nest, NestList, NestTree, NestGraph)
Further reading and learning resources
Further reading and learning resources
General Wolfram Language learning
General Wolfram Language learning
An Elementary Introduction to the Wolfram Language (book you can read online)
The Wolfram Language: Fast Introduction for Programmers (really neat tutorial if you’ve programmed before)
Data science and data processing
Data science and data processing
Wolfram U: Handling Geographic Data and GIS Functionality in Wolfram Language (this one is by me)
Data visualisation
Data visualisation
Video series: Mathematica Essentials