Swing the Logarithmic Curve around (1, 0)
Swing the Logarithmic Curve around (1, 0)


The logarithmic function to the base , where and , is defined by if and only if ; the domain is and the range is .
b
b>0
b≠1
y=x
log
b
x=
y
b
0<x<∞
-∞<y<∞
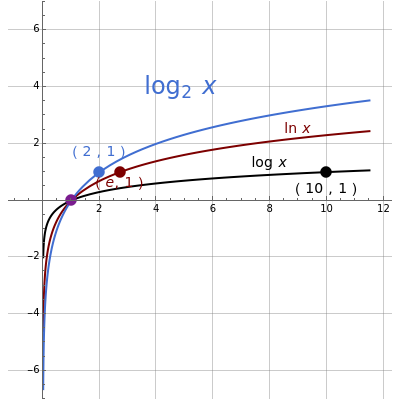
Move the slider; the base of the logarithm changes and you see its graph swing around the point .
(1,0)
Closely observe the two cases and . Also notice where the blue curve lies in relation to the common logarithm (base 10) and the natural logarithm .
0<b<1
b>1
log
ln
Details
Details
When considering the common logarithm (i.e., base 10), we notice that as the values decrease from 1 to 0, the curve falls rapidly, and for , it approaches the negative axis asymptotically. As the values increase from 1 to 10, the function increases monotonically from 0 to 1, and as values increase by a factor of 10 (for example, from 10 to 100) the function increases from 1 to 2. The same applies for the intervals , , and so on. Because the changes are very small for such large intervals, the curve can be well approximated by a straight line.
x
x0
y
x
x
100≤x≤1000
1000≤x≤10000
To switch bases, we let x=m; we will show that x=xa.
log
a
log
a
log
b
log
b
By definition, x=m implies .
log
a
x=
m
a
Taking the to the base of both sides gives x==ma.
log
b
log
b
log
b
m
a
log
b
Dividing by a gives . Replacing by x yields x=xa.
log
b
m=xa
log
b
log
b
m
log
a
log
a
log
b
log
b
External Links
External Links
Permanent Citation
Permanent Citation
Abraham Gadalla
"Swing the Logarithmic Curve around (1, 0)"
http://demonstrations.wolfram.com/SwingTheLogarithmicCurveAround10/
Wolfram Demonstrations Project
Published: March 7, 2011