In[]:=
AreaSpheresPlane::usage="Calculate the area in red (visualize the figure in 3D).References: Internet: Ronny on line (figure); Personal.";
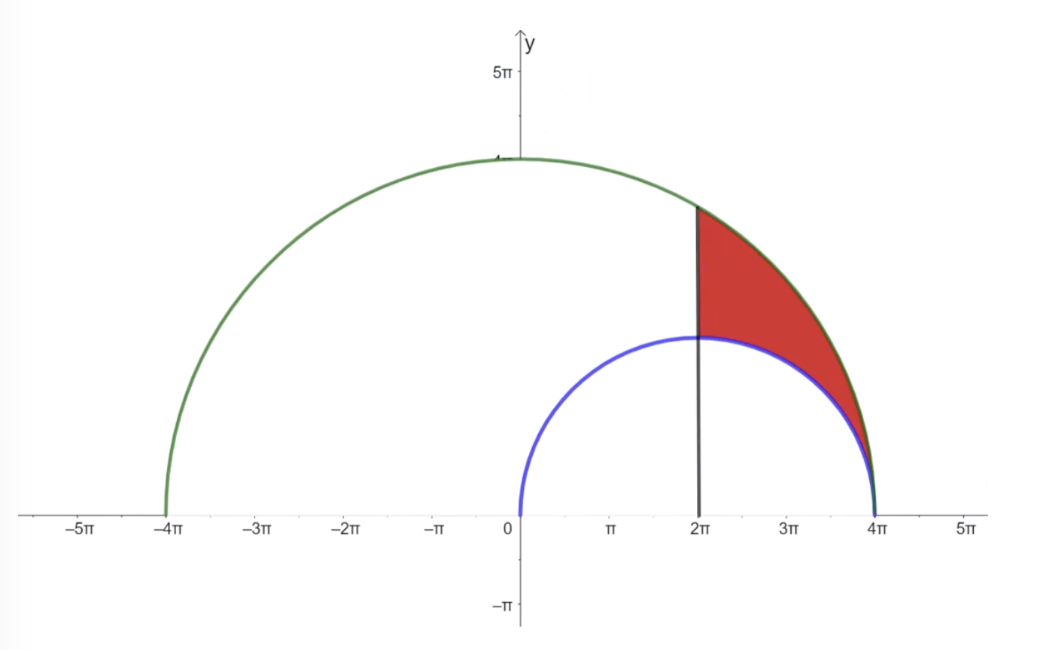
Development for surface area:
In[]:=
ℜ=ImplicitRegion[++<=16&&++>=4&&x>=2π&&z>=0,{x,y,z}];SurfaceArea[ℜ]
2
x
2
y
2
z
2
π
2
(x-2π)
2
y
2
z
2
π
Out[]=
-(6-29)
2
3
3
2
π
3
π
In[]:=
-6-29;
2
3
3
2
π
3
π
Animation:
In[]:=
Manipulate[Show[ContourPlot3D[{++==16,++==4},{x,2π,4π},y,-2++<=16&&++>=4&&x==2π&&z>=0,{x,2π,4π},y,-2++<=16&&++>=4&&z==0,{x,2π,4π},y,-2
2
x
2
y
2
z
2
π
2
(x-2π)
2
y
2
z
2
π
3
π,23
π,{z,0,t1},ContourStyle->Directive[Red,Opacity[0.5],Specularity[White,40]],Mesh->None],RegionPlot3D[2
x
2
y
2
z
2
π
2
(x-2π)
2
y
2
z
2
π
3
π,23
π,{z,0,t1},Mesh->None,PlotStyle->Directive[Red,Opacity[0.5],Specularity[White,40]]],RegionPlot3D[2
x
2
y
2
z
2
π
2
(x-2π)
2
y
2
z
2
π
3
π,23
π,{z,0,t1},Mesh->None,PlotPoints60,PlotStyle->Directive[Red,Opacity[0.5],Specularity[White,40]]],AxesLabel->(Style[#,15,Blue]&/@{"X","Y","Z"}),Axes->True,Boxed->False,BoxRatios->Automatic,ViewPoint->{-1,-2.4,1.},ImageSize700,PlotRange{2π,4π},-23
π,23
π,0,23
π],{{t1,0.00002,"Value (t1)"},0.00001,2Sqrt[3]π,0.00001},ControlPlacement->Top,SaveDefinitions->True]Out[]=


Note: Thank you very much for your contributions: Gianluca Gorni and Michael Rogers. The hole disappeared!!