EDITOR NOTE: While this scientific work and results are general and independent from software version, some elements of Wolfram Language here might have experimental nature and were implemented as a part of Wolfram Student Ambassador program.
We consider all currently known stars with planets, which consists of Sun and all currently confirmed exoplanets in extrasolar star systems. We then count number of planets per star and model their probabilities. These are the data of observed planets or planets in human database, so probabilities we find are different from those based on choosing a random star in the universe with an actual as opposed to observed planet number. We show that the data can be described quite well with a simple probability model known as Borel–Tanner distribution, which passes Pearson’s chi-squared test. We find that predicted probabilities of not-yet-found 9- and 10-planet system in the expanding future human database are and correspondingly.
1.92256×
-4
10
8.70447×
-5
10
Introduction
Introduction
What exoplanet and exoplanet systems are:
What exoplanet and exoplanet systems are:
By its definition, exoplanets are planets that are located beyond our solar system. Most of the exoplanets discovered so far are in a relatively small region of our galaxy, the Milky Way.
Exoplanets’ discovery is a hard and tricky proceses. The most used methods for the detection are: transit method, radial-velocity method, direct imaging, pulsars timing and transit timing variations. Here are some key techniques that these methods involve: observing the slight dimming of a star’s light as a planet passes in front of it and observing the spectra stars for signs of “wobble”, where the star is found to be moving towards and away from Earth when it is orbited by a planet.
Exoplanets with the stars they are orbiting form an exoplanetary systems, which can be very different from our own Solar system. Scientists divided exoplanetary systems into some categories, here are some of them: single-exoplanet systems, binary-star exoplanetary systems, multiple-exoplanet systems, planetary systems around evolved stars. When we just had our own Solar System’s eight planets to study, our view of what kind of planetary systems are possible in the Cosmos was limited.
Probability of N-planet star in the universe vs in human database:
Probability of N-planet star in the universe vs in human database:
It is important to emphasize the difference between the “observed” probability studied here (that of N-planet in human database) and probability of star in the universe to have N planets. To see the differences practically, we note that, first of all, we are not even considering stars with zero planets -- our data consists only of stars with planets. Furthermore, a star in the data might have less planets than the corresponding actual star in the universe due to difficulties of exoplanet detection process -- there are no guarantees some planets were not missed during observation. It is still quite interesting to study the probabilities in the observed data. One can imagine, in the far future, the “observed” probabilities should match close the ones of actual stars as the process of exoplanet detection becomes more precise.
Short overview of exoplanet data in Wolfram Language
Short overview of exoplanet data in Wolfram Language
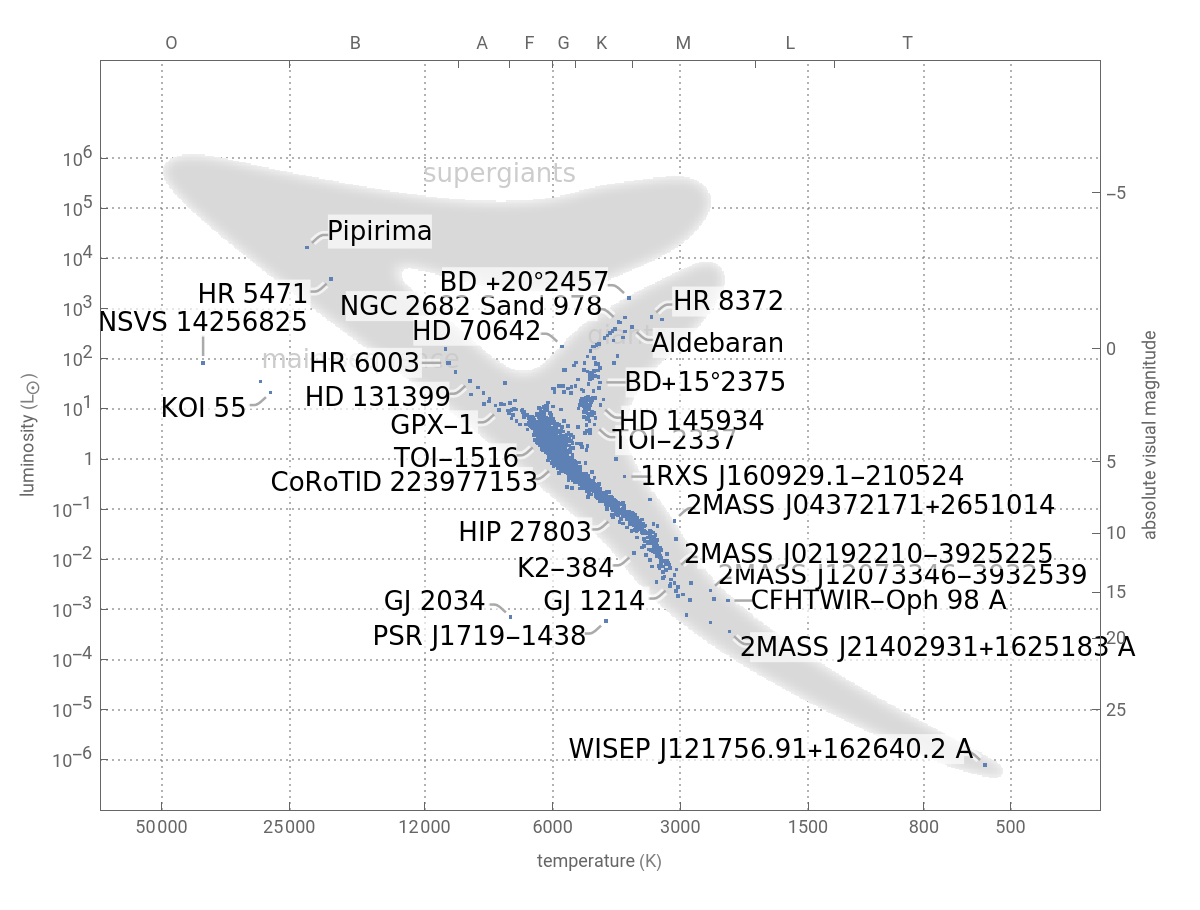
In Wolfram Language the stars that are known to have planets are collected as a special EntityClass that includes Sun and many stars with confirmed exoplanets as gathered from various sources. Here is the Hertzsprung-Russell diagram for this class, which is a graphical representation of the relationship between stars’ luminosity (how bright they are) and their temperature (how hot they are):
In[]:=

As new exoplanets are discovered their number is constantly changing. The are currently 5213 confirmed exoplanets that can be accessed in Wolfram Language via a few different calls:
In[]:=
EntityClass["Exoplanet",All]//EntityList//LengthEntityList["Exoplanet"]//LengthExoplanetData[]//Length
Out[]=
5213
Out[]=
5213
Out[]=
5213
These stars and their exoplanets were discovered during several last decades and by taking years when each planet was discovered we can see how many of them were discovered in a particular year. In this case, our keys are years, and associations are numbers of how many new planetary discoveries have been made.
In[]:=
years=KeySort[KeyMap[#["Year"]&,Counts@DeleteMissing[EntityClass["Exoplanet",All]["DiscoveryYear"]]]]
Out[]=
19891,19922,19931,19941,19951,19962,19975,19982,19997,200019,200114,200226,200327,200431,200531,200639,200747,200846,200977,201099,2011179,2012165,2013122,2014884,2015151,20161522,2017151,2018315,2019200,202086,2021525,2022358,202375
We can also visualize it as a bar chart:
BarChart[Values[years],ChartLabels->Keys[years],BarOrigin->Left,PlotTheme->"Detailed",AspectRatio->1,PlotLabel->ToUpperCase@"exoplanet discoveries per year",BaseStyle->13,ImageSize->500]
Out[]=
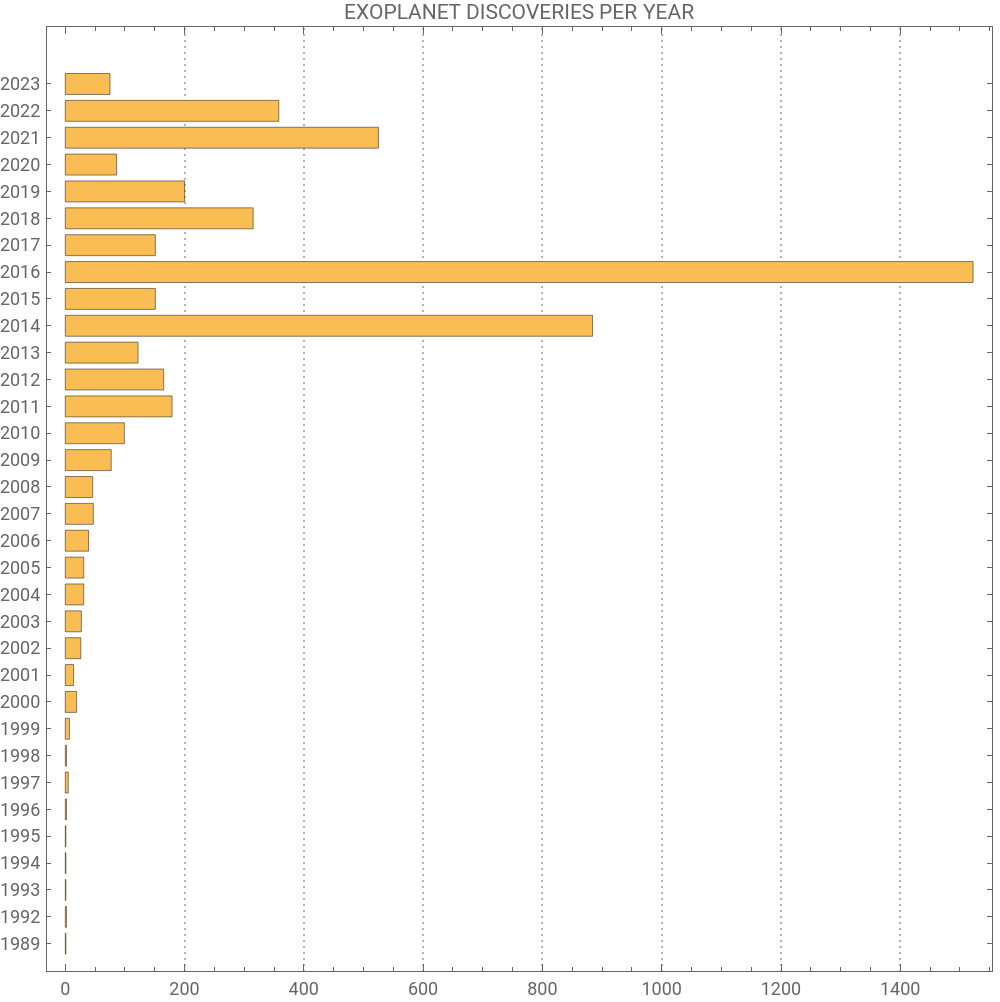
The bar chart above demonstrates that a big amount of planetary discoveries were made in last two decades. The Kepler Space Telescope, launched in 2009, played a significant role in the surge of planetary discoveries. By continuously monitoring a specific region of the sky for exoplanetary transits, Kepler provided a wealth of data that enabled scientists to identify and confirm numerous exoplanets. Many of the discoveries made in 2016 were based on Kepler’s extensive observations.
Building data structure for stars and their exoplanets
Building data structure for stars and their exoplanets
The data available in the Wolfram Language need to be structure properly for our research. Our goal is to get a simple list of integers each representing the number of planets orbiting a particular star. First we build an where a key is a star and its value is a list of its known planets or satellites. The is sorted with the largest systems appearing first.
Association
Association
In[]:=
exoSYS=ReverseSortByEntityValue,"Satellites","EntityAssociation",Length;
We will Iconize this data and save in the notebook to call it in case they are not accessible over the internet:
exoSYS=;
In total there are currently 3914 know stars with planets:
In[]:=
exoSYS//Length
Out[]=
3914
with a few with the largest planet numbers shown below:
In[]:=
exoSYS//Shallow
Out[]//Shallow=
,,,,,,,,,,,,,,,,,,,,,,,,,,,,,,,,,,,,,,,,,,,,,,,,,,,,,,,,,,,,,,,,,,3904
As we got these associations we can count the amount of elements inside each list of planets and therefore to get the lengths of all lists.
In[]:=
exoSYSn=Length/@exoSYS;sysNUB=Length[exoSYSn]exoSYSn//Shallow
Out[]=
3914
Out[]//Shallow=
8,8,7,7,6,6,6,6,6,6,3904
It can also be viewed in a table form:
In[]:=
Out[]=
STAR | PLANET NUMBER |
8 | |
8 | |
7 | |
7 | |
6 | |
6 | |
6 | |
6 | |
6 | |
6 | |
<<3903>> | ⋮ |
1 |
The main data, that we are going to find a distributional model for, are just integers (values) of numbers of planets per each star. So, we take only values, without keys, which are stars.
Goal of the study
Goal of the study
From these numbers of star systems we can compute the observed probabilities of finding a star with n planets in our data. A simple way to find a probability is to divide the count of specific outcomes by the count of total possible outcomes.
A histogram is a visual representation of how data are distributed and shows the frequency/count of a specific values. The values of planet numbers, in our case, go from 1 trough 8, and the corresponding probabilities for each of them are shown above. We can plot a histogram for our data set. The goal of this project is to find an analytic model or formula for the probabilities.
Modeling data with named probability distributions
Modeling data with named probability distributions
FindDistribution function uses smart algorithms to find best-fit distribution formulas from a set of many already known “named” models that were used to solve other scientific problems. This helps to reduce manual human processing and search for such models. We run an automated search for 10 best distribution fits and excluded any mixture distributions to avoid complex multi-distribution fits. Final result is 7 simple single-distribution models. They and their fitted parameters that define distribution shape are given below:
Now, we can plot all 7 fitted distributions on the data histogram and compare them with it and with each other:
Some distributions stay pretty close to data visually (the first 4), but only one, Borel–Tanner distribution, pass PearsonChiSquareTest:
Statistical fitting methods give slightly different value for the constant:
But with much higher p-value:
So we will use it as our final model:
The full analytic formula to compute probabilities is:
To appreciate the model fit visually we plot it now separately from other models relative to the data histogram:
The general formula for Borel–Tanner distribution is
where a is single defining parameter. We can build a small app that allows manually adjust the parameter and see how the shape of the distribution changes:
Extrapolating data from mode and making predictions
Extrapolating data from mode and making predictions
Now we can extrapolate our model beyond our data. For example, we can predict that, that as more exoplanets are discovered and their database expands, the probability of e.g. 9- and 10-planet system in the human data is
And we can visualize our extrapolated predictions for a few more values. We use log-scale for vertical axis of probabilities so the predict values can be seen better:
Conclusion and future direction
Conclusion and future direction
As new exoplanets are discovered and data expand and change, the statistics and the model investigated here might change too. In addition, it would be interesting to derive a theoretical distribution for probability of the actual number of planets around a star and compare to the one found in this work.
The discovered model can be used for developing exoplanet detection strategies. Large datasets from surveys like the Kepler and TESS missions contain information about potential exoplanets. Our statistical model, combined with data mining and machine learning algorithms, could employ to search for patterns and identify planet candidates. These methods could help automate the detection process and prioritize objects that require further investigation.
Acknowledgments
Acknowledgments
I want to thank to my mentor Mr. Vitaliy Kaurov for his assistance and guidance, as well as my math teacher in Mountain View High School Mr. Brian Perryman for his design of the general outline for the project.
CITE THIS NOTEBOOK
CITE THIS NOTEBOOK
Probability of n-planet star in human data
by Alisa Zaitseva
Wolfram Community, STAFF PICKS, May 23 2023
https://community.wolfram.com/groups/-/m/t/2924315
by Alisa Zaitseva
Wolfram Community, STAFF PICKS, May 23 2023
https://community.wolfram.com/groups/-/m/t/2924315