The data
The data
I have a set of measurements taken over time:
In[]:=
(*Ifthere'sabetterwaytoenterthistimestampdata,inquiringmindswanttoknow*)timestamps={TimeObject[{1,04}],TimeObject[{2,07}],TimeObject[{3,12}],TimeObject[{4,16}],TimeObject[{5,21}],TimeObject[{6,25}],TimeObject[{7,29}],TimeObject[{8,34}],TimeObject[{9,38}],TimeObject[{10,42}],TimeObject[{11,46}],TimeObject[{12,51}],TimeObject[{13,55}],TimeObject[{14,59}],TimeObject[{16,04}],TimeObject[{17,09}],TimeObject[{18,15}],TimeObject[{19,22}],TimeObject[{20,29}],TimeObject[{21,36}],TimeObject[{22,44}],TimeObject[{23,53}]};(*Sometestrunsarelongerthanothers,soIpaddedouttheshorterrunswithNull*)measurements1={0,1065,1420,1535,1615,2185,2470,2720,3210,3790,4450,5030,5190,5190,5650,6570,Null,Null,Null,Null,Null,Null};measurements2={0,710,710,1210,1540,1735,2170,2595,2950,3280,3885,4425,4755,5450,6110,6470,6995,7620,7850,7965,8185,8625};(*doublecheckthey'reallthesamelength*)Length[timestamps]==Length[measurements1]==Length[measurements2]
Out[]=
True
In[]:=
Row[timestamps](*reprintoftimestamps,tobelegiblewhilegathering&enteringmeasurements*)
Out[]=
And here’s what the data looks like
And here’s what the data looks like
In[]:=
pointList1=Thread[{timestamps,measurements1}];pointList2=Thread[{timestamps,measurements2}];DateListPlot[{pointList1,pointList2},PlotLegends{"first run, slot 3","second run, slot 3"}]
Out[]=
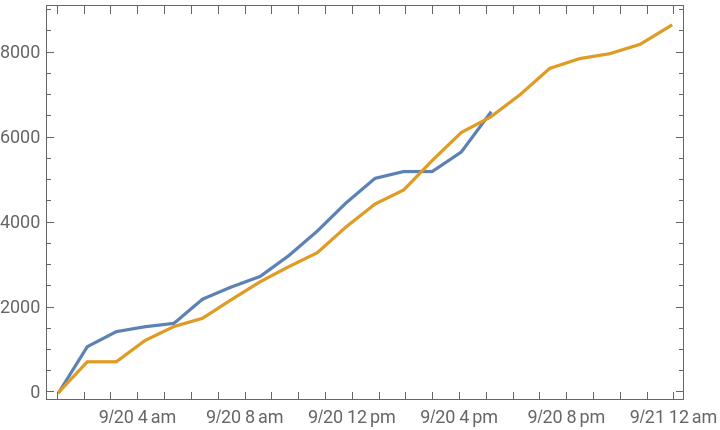


The data is noisy; I’m guessing further runs of the experiment will smooth out some of the bumpiness.
How can I do this?
How can I do this?
I suspect that there may be a standard model that fits the data well. It might even turn out to fit a linear plot. But it might also be some subtle curve hiding under the noise . So I'd like to overlay some models on top of the data .
I’ve guessed the first approach I should probably test is LinearModelFit, but am unable to decipher the parameter list. I’ve tried a simple copy/paste of the basic example with less than stellar results:
I’ve guessed the first approach I should probably test is LinearModelFit, but am unable to decipher the parameter list. I’ve tried a simple copy/paste of the basic example with less than stellar results:
In[]:=
lm=LinearModelFit[pointList2,x,x]

Out[]=
LinearModelFit,0,,710,,710,,1210,,1540,,1735,,2170,,2595,,2950,,3280,,3885,,4425,,4755,,5450,,6110,,6470,,6995,,7620,,7850,,7965,,8185,,8625,,,,,,,,,,,,,,,,,,,,,,,,,,,,,,,,