Financial news articles play a crucial role in driving stock market trends, often triggering swift market reactions. By capitalizing on the speed of artificial intelligence in processing and reacting to these news articles, an advantage can be gained in navigating the stock market. This research investigates this premise, hypothesizing that the integration of news articles and stock price history can effectively predict market movements. Utilizing Wolfram Language and large language models GPT-2 and BERT, we developed and trained a series of classifiers, leveraging the text from news headlines and historical stock prices as inputs. Our results indicate that the incorporation of financial news does indeed enhance the prediction accuracy, with the model that merges GPT2 embeddings and stock price history delivering the best performance. Future work aims to fine-tune this approach by adjusting the historical data length and prediction horizon, and incorporating bid-ask spreads, with the ultimate goal of creating a practical tool that can anticipate market trends swiftly and accurately based on the combined influence of financial news and stock price history.
Introduction
Introduction
In today’s digital era, with an abundance of readily available information, financial markets have become more interconnected and complex than ever before. Consequently, the traditional methods of financial analysis often fall short in capturing the multifaceted nature of market behavior. This necessitates an advanced, multidimensional approach that harnesses the potential of modern technology to generate actionable insights from the vast amount of financial information.
One significant and largely untapped source of financial data is news articles. Various studies suggest a relationship between financial news and stock market performance (Tetlock, 2007). However, extracting meaningful insights from this type of data is a challenging task due to its unstructured and complex nature.
In response to these challenges, this project endeavors to integrate Large Language Models (LLMs), particularly the GPT-2 model, with the Wolfram Language’s robust capabilities. This amalgamation allows for effective data preprocessing, feature extraction, machine learning, and visualization. The project focuses on understanding the impact of financial news on real-time stock market behavior, with an objective of providing predictive insights into stock market movements.
With this, we come to the goal of the project: Develop an AI-driven model that leverages the GPT-2 language model and real-time financial news to predict minute-by-minute stock price fluctuations.
This interdisciplinary approach aims to push the boundaries of market analysis and forecasting using LLMs, serving as a potentially valuable resource for economists, financial analysts, and investors.

Background
Background
The Impact of Financial News on Stock Prices
The Impact of Financial News on Stock Prices
Financial news is a critical factor that drives stock market dynamics, often triggering significant fluctuations in stock prices. Market participants frequently monitor news on a variety of aspects including economic indicators, company earnings reports, policy changes, global events, and more to shape their investment decisions. The financial news domain encapsulates a wealth of information that goes beyond the raw numbers of the market, offering insights into macroeconomic trends, industry shifts, corporate strategies, and investor sentiment.
A number of empirical studies have emphasized the significance of financial news in stock market behaviors. In a pivotal study, Tetlock (2007) suggested that the tone of financial news, whether positive or negative, can considerably influence stock price movements. He demonstrated that negative words in financial press releases and reports could predict lower firm-level stock returns, thereby substantiating the influential role of news in shaping market trends.
Furthermore, Engelberg and Parsons (2011) revealed that the causal impact of media in financial markets is profound, with information dissemination playing a crucial role in pricing securities. Their research highlighted how the speed and extent of news dissemination can impact trading behaviors and, ultimately, asset prices.
The role of news goes beyond short-term stock price movements. According to Dougal et al. (2012), the tone and content of news can also predict firms’ long-term cash flow dynamics. This indicates that the influence of news permeates into more fundamental aspects of firms and their valuation in the stock market.
Collectively, these studies underline the significance of financial news in the stock market, not just in influencing short-term price volatility, but also in forecasting long-term trends and company valuation. Therefore, the ability to harness and analyze the vast array of information present in financial news can provide market participants with a valuable tool in making informed investment decisions and predicting future market movements.
Challenges and Limitations in Traditional Financial Market Analysis
Challenges and Limitations in Traditional Financial Market Analysis
While the importance of financial news in driving stock prices is well-established, several limitations persist in the traditional methods of financial market analysis. First, the overwhelming volume of financial news data presents immense challenges in terms of extraction and interpretation of crucial information. The traditional manual analysis becomes impractical due to these time constraints and the sheer impossibility of processing the constantly expanding stream of financial news.
Second, traditional analysis frequently falters with the complexity and subtlety of language used in financial news. The task of identifying the tone, contextual implications, and the actual impact of a news event on diverse market entities is anything but straightforward.
Third, the latency inherent in traditional news processing methods can lead to missed opportunities, especially considering the high-speed nature of today’s financial markets. The advent of algorithmic trading, where investment decisions are made in fractions of a second, necessitates capabilities for real-time news processing and interpretation.
In the face of these limitations, the field has seen a marked increase in the application of Machine Learning (ML) and Natural Language Processing (NLP) techniques, aimed at automating and augmenting the analysis of financial news. Despite these promising advancements, challenges persist in enhancing the accuracy and speed of these techniques.
Here, the potential of Artificial Intelligence (AI) and ML models cannot be overstated. AI and ML models have the capacity to digest and analyze news articles significantly faster than a human possibly could. This temporal edge could prove to be instrumental in the financial market, where timely decisions can lead to substantial economic gains or avert catastrophic losses. Furthermore, these models can continuously learn and adapt from the vast amount of financial news data, improving their predictive performance over time. Thus, the incorporation of AI and ML in financial market analysis represents a transformative shift toward more efficient, effective, and timely decision-making processes. However, the potential of these models is yet to be fully realized, which is the focus of the research efforts described in this report.
LLMs for Stock Forecasting: An Overview
LLMs for Stock Forecasting: An Overview
In this section, the central thrust of this research—using Large Language Models (LLMs) for stock price prediction—is detailed, including their operational dynamics and their possible contributions to financial markets.
Development of Large Language Models
Development of Large Language Models
The journey of language model development commenced with simplistic models like n-gram, gradually moving towards sophisticated architectures as limitations surfaced. The game-changer arrived in the form of transformer-based models like GPT (Generative Pretrained Transformer) and BERT (Bidirectional Encoder Representations from Transformers), introduced by notable organizations like OpenAI and Google. The transformer architecture’s strength lies in its ability to understand long-range dependencies in text data using self-attention mechanisms.
Notably, GPT models have shown great strides in the field, with GPT-3, trained by OpenAI, comprising an impressive 175 billion parameters. The ability of such large language models (LLMs) to mine significant insights from vast text data volumes, including financial news, has greatly aided predictive analytics in finance. Despite the challenges associated with predicting stock prices, ongoing research and advancements in LLMs hold immense potential for their application in the financial sector.
Notably, GPT models have shown great strides in the field, with GPT-3, trained by OpenAI, comprising an impressive 175 billion parameters. The ability of such large language models (LLMs) to mine significant insights from vast text data volumes, including financial news, has greatly aided predictive analytics in finance. Despite the challenges associated with predicting stock prices, ongoing research and advancements in LLMs hold immense potential for their application in the financial sector.
Application of LLMs in Stock Market Predictions
Application of LLMs in Stock Market Predictions
Large Language Models (LLMs), in the context of this research, are utilized to predict stock market trends based on financial news headlines. Given a specific headline as an input, the LLM evaluates it against the backdrop of historical minute-by-minute stock data for a particular ticker symbol. The model then forecasts whether the stock price will rise or fall in the next minute. This research aims to dive deep into this high-level interaction of language interpretation and financial forecasting, aiming to make contributions in the accuracy of stock market predictions.
Building the Models: A Sequential Approach
Building the Models: A Sequential Approach
The construction of predictive models in this study follows a sequential, step-by-step approach, enabling a detailed examination of the incremental predictive power of each additional component. The methodology follows a five-step process, ensuring that the model complexity is increased gradually and systematically, allowing for a nuanced understanding of the impact of each component.
The construction of predictive models in this study follows a sequential, step-by-step approach, enabling a detailed examination of the incremental predictive power of each additional component. The methodology follows a five-step process, ensuring that the model complexity is increased gradually and systematically, allowing for a nuanced understanding of the impact of each component.
1
.Training a Classifier on Just Headlines: This initial step uses only news headlines as input to train a classifier, providing a baseline measure of the predictive power of raw headlines on the future stock prices.
2
.Integrating Historical Price Data with Headlines: The second stage incorporates the stock’s price history alongside news headlines. By adding this historical context, the classifier can learn patterns from past price movements in tandem with news data, potentially improving its predictive capabilities.
3
.Leveraging GPT-2 Embeddings of Headlines: The third phase enhances the classifier by replacing raw headlines with their corresponding GPT-2 embeddings. These embeddings are 768-dimensional vector representations that capture the semantic content of the headlines more accurately than raw text. This step explores whether this richer representation of news can further improve prediction performance.
4
.Joining GPT-2 Embeddings with Price History: In the fourth step, the GPT-2 embeddings of headlines are combined with the stock’s price history. This integrates the enriched headline representation and historical price context, providing the classifier with a comprehensive input to learn from.
5
.Training on a Control Set: The final step introduces a control set into the process - training the model on data that only includes the last 10 price points and non-financial news. This step helps to establish a control performance level, isolating the impact of financial news from other price-driving factors.
Importing and Cleaning News Data
Importing and Cleaning News Data
This subsection is all about importing and cleaning the data. The initial dataset is imported as strings to prevent errors with corrupted rows that might be present in the data.
The Financial News Dataset was sourced from: https://www.kaggle.com/datasets/miguelaenlle/massive-stock-news-analysis-db-for-nlpbacktests
Dataset Description:
Context
Gaining access to high-quality (historical) stock market news data is hard and expensive; subscriptions to historical news data provider services can cost thousands of dollars. Here, I’ve compiled stock news data scraped directly from its source into an easy-to-use format. I’ve also provided the scripts used to get this data and the scripts I use for personally trading this data in real-time here: https://github.com/bot-developer3/Scraping-Tools-Benzinga.
Content
raw_analyst_ratings.csv
Directly-scraped raw analyst ratings
Columns are as follows: index, headline, URL, article author (publisher is always benzinga), publication timestamp, stock ticker symbol.
Note that all dates on this CSV file don’t contain exact hour-minute-second information. If you plan on using this file to backtest (analyst_ratings_processed.csv is better), assume that the article was published the next day instead of the day shown on the current article.
raw_partner_headlines.csv
Directly-scraped raw news headlines
Columns go as follows: index, headline, URL, publisher (NOT benzinga), date, stock ticker. For this CSV, it isn’t possible to get exact dates
For this CSV, it isn’t possible to get precise hour-minute-second timestamps for the dates. Do what is stated for backtesting in the previous note for this CSV too.
analyst_ratings_processed.csv
Processed analyst ratings
Columns go as follows: article title, date, stock
Timezone is UTC-4. The difference between this and raw_analyst_headlines is that this has exact dates to the minute vs. raw_analyst_ratings which is only the day without hour or minutes.
Importing each row as strings
Importing each row as strings
To handle instances of corrupted rows, ReadList is used instead of Import. This allows for the data to be imported as a list, offering a more efficient method of dealing with potential data irregularities.
In[]:=
newsData=ReadList["C:\\financial_news\\analyst_ratings_processed.csv",String];
Deleting mismatched rows
Deleting mismatched rows
To ensure data quality, rows that do not match the expected structure are filtered out. This is done by checking the number of values in each row, the format of the first and second last values, and the timestamp length.
Selecting rows such that:
1
.There are at least 4 values separated by commas
2
.The first value of each row before the comma is a number
3
.Second last value is a timestamp with 25 characters
In[]:=
newsDataClean=Select[StringSplit[newsData,","][[2;;]],Length@#>=4&&StringLength@#[[-2]]==25&&StringDelete[First@#,DigitCharacter..]==""&];
Separating tickers, times, and headlines
Separating tickers, times, and headlines
Next, the cleaned data is separated into different components - tickers, times, and headlines.
In[]:=
tickers=newsDataClean[[;;,-1]];times=newsDataClean[[;;,-2]];
Joining the remaining columns to get the headlines (they got separated because there were commas inside those headlines)
In[]:=
headlines=StringJoin/@newsDataClean[[;;,2;;-3]];
Converting times to Date Object
Converting times to Date Object
The time data is converted to Date Objects for easy processing and manipulation in later steps.
times=DateObject[#[[;;6]],TimeZone->"GMT-"<>ToString@#[[7]]]&/@ToExpression/@StringSplit[times,"-"|":"|" "][[;;,;;7]]
Final Cleaned data
Final Cleaned data
The final cleaned data consists of times, headlines, and tickers. It’s then grouped and sorted by the number of articles associated with each ticker.
In[]:=
newsDataFinal=Transpose@{times,headlines,tickers}//EchoFunction@Length;
»
1397257
Group the data and sort by number of articles
Group the data and sort by number of articles
In[]:=
groupedNewsData=ReverseSortBy[GroupBy[newsDataFinal,#[[-1]]&],Length];
Top 50 Tickers
Top 50 Tickers
Finally, the top 50 tickers with the most news articles are identified and their data is further refined to include only articles from a specific date range.
In[]:=
topTickers=Keys[groupedNewsData][[;;50]]
Out[]=
{MRK,MS,MU,NVDA,QQQ,M,EBAY,NFLX,GILD,VZ,DAL,JNJ,QCOM,BABA,KO,ORCL,FDX,HD,WFC,BBRY,BMY,JCP,LLY,AGN,CMG,CAT,GPRO,TWX,CHK,FSLR,NOK,P,LMT,MCD,MA,EA,FCX,EWU,GPS,PEP,XLF,GRPN,TM,GLD,EWP,HAL,LOW,XRT,ADBE,AZN}
Visualizing the dataset
Visualizing the dataset
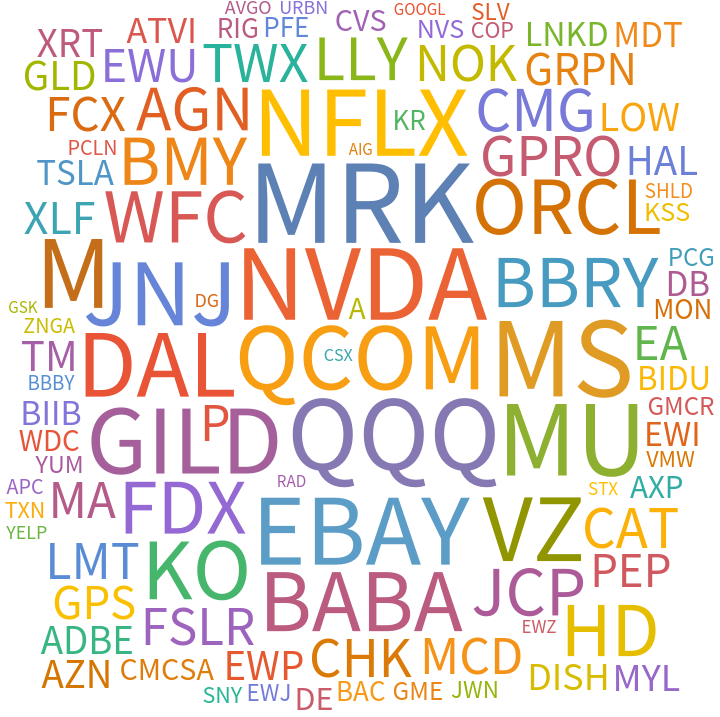
The initial exploration of the dataset in this research was carried out through visualizations, an effective way to gain insights about the distribution, relationships, and potential patterns in the data. The data visualizations generated included word clouds of stock tickers, date histograms, and time series plots.
The word cloud of stock tickers gave an immediate sense of the stocks that were most frequently mentioned in the news data. These ticker symbols represented the companies that were most often in the news, potentially indicating a significant impact on their stock prices due to high media coverage.
Date histograms helped assess the temporal distribution of the news articles. This visualization revealed trends in the data over time, highlighting periods of high news activity which could correspond with market volatility. By tracking the ebb and flow of news over time, the project could pinpoint key time periods that might have a significant impact on stock prices.
Finally, time series plots were used to visualize stock prices over time. These plots provided a direct view of the stocks’ performance and trends over time, aligning this performance with the news cycle could provide fascinating insights.
This exploratory visualization phase was instrumental in guiding the focus of this research. The substantial information revealed from these plots and clouds led to a decision to concentrate on the top 50 tickers with the most articles. This strategy was driven by the belief that a larger volume of data for these particular stocks would enable more robust training of the machine learning models and, in turn, yield more accurate and insightful results. The visual analysis provided a concrete direction and a focused approach for the subsequent stages of this research.
Word Cloud of tickers
This visualization provides a visual representation of the distribution of the tickers in the dataset. The size of each ticker symbol in the word cloud corresponds to its frequency of occurrence. A larger symbol indicates that the corresponding ticker has more articles associated with it.
Out[]=
Number of articles per ticker
This section involves tabulating the count of articles associated with each ticker. The table is arranged in descending order starting with the ticker that has the most number of articles. This can provide insights into which companies are getting the most attention in the news.
Out[]=


Date Histograms
Date histograms serve as a powerful tool for visualizing the temporal distribution of financial news articles. They can uncover patterns, cycles, or spikes in article publication, potentially linked to significant financial events or periods of heightened market activity. The Manipulate function has been incorporated to seamlessly navigate through various ticker trajectories across different timeframes, providing an insightful overview of each ticker’s representation in the news over time.
Visualizing stock prices over time
Time series plots, or DateListPlots in the context of the Wolfram Language, offer a visual representation of stock prices over time. These plots provide an insightful perspective into the dynamic behavior of individual stocks, revealing trends, volatility, and notable price changes. Understanding these patterns is crucial for financial forecasting and decision-making. By mapping out stock prices against time, these plots can assist in identifying potential correlations between news events and price fluctuations.
Timeseries Plots for Top 4 Tickers With Most Number of News Articles
3D Visualization of Stock Prices Over Time
Preparing Minute-Minute Stock Price Data
Preparing Minute-Minute Stock Price Data
Loading Data With Minute Resolution Stock Prices
Loading Data With Minute Resolution Stock Prices
Minute-resolution stock price data serves as a crucial resource for understanding intricate market dynamics, particularly when correlating stock price movements with financial news events. This analysis, which covers the period from November 15, 2017, to June 1, 2020, harnesses the detail within these granular fluctuations to identify potential immediate impacts precipitated by such events. Therefore, by focusing on these nuanced changes, this study seeks to illuminate the intimate relationship between real-time financial news and market responses.
Function to convert date string to DateObject in NY Time Zone
Function to convert date string to DateObject in NY Time Zone
Time zone conversion is a necessary step when dealing with global data sources. Since the stock market operates based on New York (Eastern) time, all date and time data should be converted to this time zone to ensure accurate alignment with market activity.
Function to import and create time series from each file
Function to import and create time series from each file
This function streamlines the data importing process by transforming raw data files into a structured time series format. Time series data is fundamental for any financial analysis as it allows for chronological analysis and simplifies the identification of trends, cycles, and other temporal structures in the data.
Creating the timeseries
Creating the timeseries
Combing News and Price Data
Combing News and Price Data
Import Minute Prices from MX File
Import Minute Prices from MX File
This step involves retrieving the preprocessed, minute-resolution stock price data that was stored as an MX file. This data will be used in combination with the news data to generate insights about stock price fluctuations in response to news events.
List of dates, headlines, and tickers of the top 50 stocks
List of dates, headlines, and tickers of the top 50 stocks
This section generates a comprehensive list of key data points for the top 10 stocks under analysis. It includes the date of each event, the associated news headline, and the corresponding stock ticker. This provides a useful summary of the primary data under investigation.
An example of the first 5 rows in the Dataset
Filtering news within trading hours
Filtering news within trading hours
Given that stock price movements happen during specific trading hours, it’s important to filter out news events that occur outside these hours. This ensures a more accurate alignment between the timing of news events and stock price changes.
Filtering data in the date range where minute prices are available
Filtering data in the date range where minute prices are available
This subsection focuses on narrowing down the dataset to a specific timeframe. The selected range, from November 15, 2017, to June 1, 2020, is determined by the availability of minute-by-minute stock prices. The purpose of this selection is to ensure the compatibility of news data with the price data for further analysis. By applying this filter, we maintain a consistent and uniform timeframe across the two data types, thereby eliminating potential temporal discrepancies. This step lays the groundwork for the more integrated analysis that follows, where we combine news data with the corresponding stock price information.
The range of years over which we have our stock price data
Getting Large Language Models
Getting Large Language Models
The GPT-2 model is retrieved in this step. This state-of-the-art language model is used to extract meaningful features from the news headlines, which are then used in the subsequent analysis.
Creating the function
Creating the function
Function to create each row of the training data
The variable historyLength determines the number of minutes of past stock prices we want to take into account. In this case, it is set to 60 minutes, indicating that our models will consider the previous hour’s stock prices to make predictions.
The function prepareData defined here is used to compile the training data for each row of our data set. It accepts an entry in the format of {time_, headline_, ticker_} and processes it to include the GPT-2 embedding of the headline and the minute-by-minute stock prices.
Here’s a breakdown of the components of the prepareData function:
◼
time, ticker, headline: These are the timestamp, the ticker symbol, and the headline text of the news article. They form the basic data for our model.
◼
Last@gpt2@headline: This uses the pre-trained GPT-2 model to generate a 768-dimensional vector that represents the headline. This vector captures the semantic meaning of the headline in a form that machine learning algorithms can work with.
◼
timeseries[ticker][DateRange[time - historyLength*Quantity[1, “Minute”], time, Quantity[1, “Minute”]]]: This retrieves the stock prices for the given ticker symbol from the timeseries object, which stores minute-by-minute stock price data. The DateRange function is used to specify the time interval we’re interested in, which starts from historyLength minutes before the timestamp of the article and ends at the timestamp.
◼
timeseries[ticker][time + Quantity[1, “Minute”]]: This retrieves the stock price for the ticker at one minute after the news article’s timestamp. This price will be used as the “ground truth” for our prediction, i.e., our model will try to predict whether the price will go up or down based on the information available one minute before this timestamp.
Lastly, the command below is an example that shows how to retrieve the last 60 minutes of stock prices for the “M” ticker symbol. The AbsoluteTiming function is used to measure the time it takes to retrieve this data.
Applying function to all rows
The primary goal here is to transform our data and extract useful information that we can feed into our machine learning models. The extracted information includes details like timestamps, stock tickers, news headlines, the GPT-2 vector representation of the headlines, and the price history of the stocks.
The execution time is also calculated for the operation to keep track of the processing time involved in this step. Monitoring time efficiency is crucial, as we aim to design a model that can swiftly and accurately react to the high-speed financial market changes.
The execution time is also calculated for the operation to keep track of the processing time involved in this step. Monitoring time efficiency is crucial, as we aim to design a model that can swiftly and accurately react to the high-speed financial market changes.
Example of one row of the final data containing time, headline, ticker, price history, and next price
Remove rows where price doesn’t change
To ensure a more insightful and accurate analysis, instances where the stock price remained constant outside the training window were removed from the dataset. This crucial step refines our training data by excluding cases where there is no significant price movement, allowing the model to focus exclusively on instances where notable changes in stock price have occurred.
Training Models
Training Models
Preparing Training Data
Preparing Training Data
In the this section, we delve into the process of getting our data ready for the upcoming machine learning tasks. A critical part of this process is ensuring our data is diverse, randomized, and representative, which is why we begin by shuffling our data.
Shuffling Data
Next, we formulate a series of functions to prepare different training sets for our various experimental models. Each model has a different set of input requirements (some will use only the news headlines, others will incorporate the price history, or even the GPT-2 embeddings of headlines). Thus, we need distinct functions to format the data appropriately for each training set.
Functions to Prepare Different Training Sets
Position to Split into Test Set
Training Classifier With Only News Headlines
Training Classifier Combining Headlines and Recent Price History
Training Classifier Utilizing GPT-2 Embeddings of Headlines
Training Classifier Integrating GPT-2 Embeddings of Headlines and Price History
Training Control Classifier with Only Historical Price Data
Once we have these functions, we proceed to create the actual training and test sets. These data subsets are essential for training our machine learning models and subsequently testing their performance on unseen data. This segregation helps us assess how well our models will generalize to new, real-world data.
Creating Training and Test Sets
In this way, this section lays the foundation for the subsequent stages of model training. The goal here is to ensure we are providing the best possible input data to our machine learning models. This meticulous data preparation process is crucial to developing accurate and robust models for predicting stock price movements based on financial news data.
Training Classifiers
Training Classifiers
This section is focused on the core computational task of training the machine learning models. These models are trained on different subsets of the data, following the previously mentioned five-step sequential approach. The TimeGoal option is used here to regulate the time spent on training each model. By setting TimeGoal -> 1000, the training process for each model is set to aim to take approximately 1000 seconds (or just over 16 minutes). This doesn’t mean the training will strictly stop at 1000 seconds, rather it is a goal that influences how the Classify function will manage its internal processes.
Results
Results
The following code outlines the procedure utilized to compute the GPT-2 embeddings. Notably, this methodology isn’t exclusive to GPT-2 and can be adapted for any Language Model. For comparison, we executed an identical process where the training model was switched from GPT-2 to BERT. This enabled us to evaluate and contrast the predictive performances of both models.
Measuring Performance
Measuring Performance
GPT2 Results
GPT2 Results
BERT Results
BERT Results
Overview of Models’ Performance
Overview of Models’ Performance
In this investigation, a series of classifiers were built and evaluated to assess their ability to predict stock market trends based on financial news articles. The objective was to utilize both the text from news headlines and historical stock price data to anticipate potential market movements. Advanced language models, namely GPT-2 and BERT embeddings, were used in an effort to augment the predictive capabilities of our classifiers.
The classifiers demonstrated varying degrees of performance. Models trained using GPT-2 embeddings had accuracy metrics ranging from 49.5% to 54.8%, while for the BERT-based classifiers, accuracies varied between 49.1% and 51.9%. This spread of accuracies underlines the complexity of predicting stock market trends from news articles and past price data, a task further complicated by the numerous factors influencing stock prices in the volatile financial markets.
Importantly, while the reported accuracies for all classifiers, regardless of the language model used, hovered around the 50% threshold, it’s crucial to recognize that in the context of financial market prediction, even a slight edge, a few percentage points above random guessing, can hold significant value. This is due to the vast number of trades and the potential monetary gains that can be realized from correctly predicting even a small fraction of price movements.
In this context, the GPT-2 based models displayed a slight edge, with their top performance reaching 54.8% accuracy, a value slightly exceeding the maximum accuracy obtained by BERT-based classifiers (51.9%). Though these numbers may seem close to a random guess, in the fast-paced, high-stakes world of financial trading, this incremental improvement can translate into considerable gains.
These findings illustrate the potential of machine learning and natural language processing in stock market predictions. The complexities of financial markets and the subtleties of news impact necessitate ongoing refinement of our models and integration of diverse and expansive data sources. Future enhancements, including refining the models and including additional influential variables, hold the promise of increasing the predictive accuracy and practical utility of our approach, further emphasizing the substantial implications of even modest improvements in prediction accuracy in the financial trading arena.
Analysis of Each Classifier’s Performance
Analysis of Each Classifier’s Performance
GPT2 Classifiers
1
.Classifier 1: Trained exclusively on news headlines, this classifier posted an accuracy of 51.9%, the highest among the GPT-2 classifiers. It demonstrates the utility of headlines in predicting market movements, despite not employing additional context or historical price data. Yet, the performance hovers only slightly above that of random guessing (50%), highlighting the limitations of relying solely on headlines for accurate predictions.
2
.Classifier 2: This classifier integrated news headlines with the most recent stock price history. Unexpectedly, the addition of stock price history did not enhance performance; this classifier achieved an accuracy of 50.2%, slightly lower than that of Classifier 1. This unexpected result may indicate that the integration of historical data into this model may not have effectively captured the potential predictive patterns inherent in the data.
3
.Classifier 3: Here, we substituted the raw text with GPT-2 embeddings of news headlines, represented by a vector of 768 numbers reflecting the linguistic features learned by the GPT-2 model. The accuracy came in at 49.5%, a marginal decrease from Classifier 2. It suggests that, in this configuration, GPT-2 embeddings may not have added substantial predictive value beyond the raw headlines.
4
.Classifier 4: The fourth classifier combined the GPT-2 embeddings from Classifier 3 with the stock price history used in Classifier 2. With an accuracy of 54.8%, this model outperformed the previous models, indicating that a holistic approach incorporating multiple forms of data could yield a more comprehensive representation of predictive patterns.
5
.Classifier 5: Serving as a control model, Classifier 5 leveraged the last ten stock prices and non-financial news. Its accuracy was 50.3%, suggesting that non-financial news and recent price changes, at least as incorporated in this model, provide only limited predictive power.
BERT Classifiers
6
.Classifier 1: Relying solely on news headlines, this classifier registered an accuracy of 51.9%, implying that news headlines carry significant predictive information about market movements. However, as the performance is only slightly above random guessing (50%), it underscores the limitations of using only news headlines for accurate predictions.
7
.Classifier 2: In the second classifier, we combined news headlines with the most recent stock price history. Despite the additional data, the classifier’s performance dropped to 50.2%, suggesting that the integration of stock price history in this particular configuration may not have successfully captured the predictive patterns in the data.
8
.Classifier 3: With this model, we replaced the raw text with BERT embeddings of news headlines. The accuracy of this classifier came out to be 49.1%, marginally lower than the previous model. This suggests that the specific configuration of BERT embeddings may not have provided substantial predictive value over and above the raw headlines.
9
.Classifier 4: The fourth classifier paired the BERT embeddings from Classifier 3 with the stock price history used in Classifier 2. It posted an accuracy of 50.1%, a slight increase from Classifier 3, indicating that the incorporation of multiple forms of data may provide a more comprehensive representation of the predictive patterns.
10
.Classifier 5: Acting as a control model, Classifier 5 employed the last ten stock prices and non-financial news for training. With an accuracy of 51.9%, it implies that non-financial news and recent price changes, in the way they are integrated in this model, could contribute some predictive power, though the performance remains near the random guess benchmark.
Comparison of Models
Comparison of Models
Classifier 1 and Classifier 2: Examining these two, it seems that incorporating recent stock price history did not boost prediction accuracy significantly. In fact, for both GPT-2 and BERT, the accuracy slightly decreased when the stock price history was added to the headlines. This could suggest that the most recent stock price movements are already reflected in the current price, limiting their additional predictive power. Another interpretation could be that the method of integrating historical prices into the model needs further refinement.
Classifier 3 and Classifier 4: These classifiers leveraged GPT-2 and BERT embeddings of news headlines, either alone (Classifier 3) or in combination with stock price history (Classifier 4). Notably, the usage of these advanced embeddings did not lead to a major increase in accuracy for either GPT-2 or BERT. This suggests that while GPT-2 and BERT are potent tools for natural language understanding, further optimization is required for this specific predictive task. However, the rise in accuracy from Classifier 3 to Classifier 4 in the case of GPT-2, but not BERT, implies that the combination of these embeddings with price history could be a beneficial strategy if the method of integration is carefully selected.
Classifier 5: The control model for GPT-2 and BERT, offers a baseline by focusing on non-financial news and recent price changes. Even with lower accuracy scores compared to other classifiers, its performance demonstrates a significant outcome. It emphasizes that these elements, even without direct financial news, have a potential predictive capacity for market trends, surpassing purely random guessing. This highlights the potential of diverse, non-financial influences on stock prices and bolsters the potential of incorporating such factors in future predictive models.
Significance of Results
Significance of Results
The significance of this study’s results goes beyond the numerical accuracies of the developed classifiers. While the figures highlight the challenging nature of predicting stock market trends using financial news and stock price history, they also indicate promising avenues for further research.
The study’s findings signify a stepping stone towards a more comprehensive and nuanced understanding of the interplay between news events and financial markets. They advocate for the fusion of traditional financial analysis with advanced machine learning techniques to better navigate the complexities of stock market predictions.
The study’s findings signify a stepping stone towards a more comprehensive and nuanced understanding of the interplay between news events and financial markets. They advocate for the fusion of traditional financial analysis with advanced machine learning techniques to better navigate the complexities of stock market predictions.
◼
Potential of Language Models: Despite the marginal prediction accuracy above random guessing, the results underscore the potential of language models like GPT-2 and BERT in processing and analyzing financial news. By converting textual data into numerical vectors, these models enable the integration of news headlines into machine learning algorithms, paving the way for more nuanced and sophisticated market analysis.
◼
Power of News Headlines: The results also suggest that even without the context of an article’s body text or stock price history, news headlines alone can contain useful signals for market prediction. The potential value embedded in the news headlines points towards the significance of public sentiment and anticipation in driving market dynamics, a factor often overlooked by traditional quantitative models.
◼
Synergy Between Data Sources: The varying performance of classifiers with and without stock price history suggests that the integration of multiple data sources could potentially enhance prediction accuracy. However, it also points towards the need for more sophisticated approaches in combining different types of data. The interaction between price trends and news sentiment could be more complex than currently modeled, warranting more advanced techniques, such as deep learning or ensemble models.
◼
Limitations and Future Directions: Finally, the results shed light on the limitations of our current approach and the need for further refinement. The complexity of financial markets necessitates the consideration of a broader range of factors, including company fundamentals, macroeconomic indicators, and global events. The potential to incorporate these factors into future models could offer an exciting direction for enhancing the predictive power of machine learning in stock market analysis.
Concluding remarks
Concluding remarks
This study aimed to decode the intricate relationship between financial news and stock market trends, employing powerful large language models, GPT-2 and BERT, alongside Wolfram Language to develop predictive models. The insights gained from the findings not only shed light on this relationship but also set a promising path forward for additional exploration and optimization.
The research reaffirmed the significant influence of financial news on stock market trends, as classifiers integrating financial news data (Classifiers 1 and 2) demonstrated superior performance compared to Classifier 5, which relied solely on the last 10 prices and non-financial news. This clearly argues for the importance of incorporating financial news in market prediction models.
Among all models, Classifier 4, which integrated GPT-2 embeddings of financial news and stock price history, emerged as the most accurate predictor. This result underlines the powerful synergy of combined data types in capturing market dynamics. Interestingly, the classifier leveraging BERT embeddings marginally surpassed its GPT-2 counterpart, hinting at BERT’s potential edge in distilling valuable information from financial news.
Crucially, our results underscore the significant value added by including financial news in our models. Specifically, the model utilizing GPT-2 news embeddings alongside historical price data improved the accuracy of the classifier from 51% to 55%. This increase, although seemingly modest, can hold considerable implications in the context of financial market predictions, indicating that insights derived from news via large language models can be valuable features for a trading algorithm.
Going forward, there are numerous avenues for further refinement. Exploring different lengths of historical data and adjusting the prediction horizon may offer more nuanced understanding of the market’s response to news over varying timescales. Additionally, incorporating bid-ask spreads could further enhance the practical utility of the models, focusing not only on predicting price changes, but also on whether the change would suffice to cross the bid-ask spread – a crucial factor in real-world trading decisions.
In essence, this research represents a vital stride towards harnessing advanced language models for financial market prediction. The journey ahead, abundant with opportunities for improvement and discovery, holds the promise of a pragmatic tool capable of predicting market trends by leveraging the combined power of financial news and stock price history.
Keywords
Keywords
◼
Financial News Analysis
◼
Stock Price Prediction
◼
Machine Learning Models
◼
Natural Language Processing (NLP)
◼
GPT-2 Embeddings
◼
News Headline Classification
◼
Textual Data Processing
Future Work
Future Work
As we transition to the next phase of this research project, a wealth of exciting opportunities emerge. Building upon the established machine learning models, the intent is to develop a comprehensive trading system within the Mathematica environment, integrating the predictive powers into actionable, intelligent trading strategies.
The subsequent steps involve creating functions to place trades, conduct rigorous backtests, monitor market conditions in real-time, and assess the models’ certainty in its predictions. The objective is not only to predict whether the stock price will rise or fall, but also to estimate by how much it will change, incorporating a measure of confidence or standard deviation in the prediction.
Considering the cost of trading, such as the bid-ask spread, is a crucial component of this endeavor. Incorporating these trading costs into the model will make it more realistic and applicable to real-world trading, where such costs can significantly impact the net returns.
Moreover, the length of the historical data used for prediction and the prediction horizon will be varied to observe their impact on the performance of the models. The goal is to find an optimal balance that allows for accurate prediction and timely action in the dynamic market environment.
The resultant system will demonstrate the potential of AI in real-time financial decision-making, illuminating the unique challenges and benefits of algorithmic trading. It seeks to push the boundaries of traditional financial strategies, paving the way for a new era in financial market interactions.
In essence, the future progression of this research project aims to redefine how we understand, interact with, and capitalize on financial markets through the synergistic use of AI, machine learning, and financial news analytics.
Acknowledgment
Acknowledgment
I would like to express my heartfelt appreciation to both of my mentors, Dr. Daniel George and Dr. Alejandra Ortiz, for their unwavering commitment and invaluable guidance throughout this research project. Their encouragement has been a driving force behind this paper.
My deepest gratitude goes to Dr. Stephen Wolfram for his integral role in conceiving this captivating research topic and for providing me the opportunity to delve into this intriguing area of study.
Moreover, my sincere thanks to Dr. Mads Bahrami for his comprehensive support and expertise during the Wolfram Summer School 2023, which greatly enriched this research journey.
Documents
Documents
Financial News Datasets: https://drive.google.com/drive/folders/1pfPwLX1XeuK6FQVsiMznn3cB5MkCadzT?usp=sharing
Top 50 Tickers’ Stock Prices from Dukascopy: https://drive.google.com/drive/folders/1RoCmcGAA3u6vfLOHYOhhaiQLxKjTvMj9?usp=sharing
Top 50 Tickers’ Stock Prices from Dukascopy: https://drive.google.com/drive/folders/1RoCmcGAA3u6vfLOHYOhhaiQLxKjTvMj9?usp=sharing
References
References
1
.Isabel Kunkle (2020) The Best Finance News websites: A wealth of information!. SmartBrief. https://corp.smartbrief.com/original/2020/07/best-finance-news-websites-wealth-information
2
.ENGELBERG, J. E., & PARSONS, C. A. (2011). The Causal Impact of Media in Financial Markets. The Journal of Finance, 66(1), 67–97. http://www.jstor.org/stable/29789772
3
.Tetlock, P. C. (2007). Giving content to investor sentiment: The role of media in the stock market. The Journal of Finance, 62(3), 1139-1168. https://doi.org/10.1111/j.1540-6261.2007.01232.x
4
.Engelberg, J. E., & Parsons, C. A. (2011). The causal impact of media in financial markets. The Journal of Finance, 66(1), 67-97. https://www.jstor.org/stable/29789708
5
.Dougal, Casey & Engelberg, Joseph & Garcia, Diego & Parsons, Christopher. (2011). Journalists and the Stock Market. Review of Financial Studies. 639-679. https://www.researchgate.net/publication/227465410_Journalists_and_the_Stock_Market
CITE THIS NOTEBOOK
CITE THIS NOTEBOOK
Forecasting stock prices using LLMs with financial news
by Vatsal Piyush Shah
Wolfram Community, STAFF PICKS, July 12, 2023
https://community.wolfram.com/groups/-/m/t/2959055
by Vatsal Piyush Shah
Wolfram Community, STAFF PICKS, July 12, 2023
https://community.wolfram.com/groups/-/m/t/2959055