Abstract: Conventional teaching and learning methodologies utilising non-interactive material can fall short of engaging students and fostering intellectual curiosity. This project presents an interactive e-book designed to reshape the pedagogical landscape of economics by showcasing vivid storytelling, insightful example problems from real-life situations, and Wolfram Mathematica interactive animations. Strategically structured into seven key sections, the e-book guides the reader from defining key principles to undergraduate-level practice material, prioritising the careful explanation of core economic intuition rather than complex terminology. Leveraging interactive elements coded using the Manipulate function, it encourages problem-solving and critical thinking, leading to a deeper understanding of economics through an engaging learning journey. Future work includes addressing areas for improvement, completing the e-book, planning and execution of distribution avenues, and marketing campaigns.
Contents
Contents
I. Introduction
I. Introduction
II. Contemporary Challenges in Economics Pedagogy
II. Contemporary Challenges in Economics Pedagogy
III. Approach and E-book Structure
III. Approach and E-book Structure
IV. Producing the Interactive Animations
IV. Producing the Interactive Animations
V. Writing Sample: Chapter 2.1, ‘A World of Incentives’
V. Writing Sample: Chapter 2.1, ‘A World of Incentives’
VI. Concluding Remarks
VI. Concluding Remarks
VII. Future Work
VII. Future Work
I. Introduction
I. Introduction
Like many others, I am a highly visual learner. Pictorial representations and colour coding have been the backbone of my class notes ever since the day I saw my first fraction. My visual inclinations led me to develop a keen interest in economics and eventually pursue my undergraduate studies at Warwick’s Department of Economics. But as I delved deeper into the subject, a significant gap became evident: the absence of online resources to dynamically illustrate economic concepts. Spotting this disconnect, I embarked on a project to bridge the gap between theoretical knowledge and practical understanding: “Deciphering Scarcity: An Interactive Primer to Economics with Wolfram Mathematica”, an e-book leveraging the dynamic capabilities of the Wolfram Language to transform static economics concepts into interactive learning experiences.
It all started with an undergraduate research grant in the Summer of ‘22, which introduced me to the Wolfram Language. With it, I have been coding graphic visualisation tools that allow students to build their economic intuition independent of traditional class materials. My experience at the Wolfram Summer School 2023 further enhanced my coding proficiency, significantly boosting the quality and performance of my codes. The Manipulate function is starting to become my speciality. But the vision for the project extends beyond the e-book. To reach a broader audience, I launched @AnguloLIVE across multiple social media platforms, promoting the Wolfram Language to a global student community and providing content that enhances learning experiences in economics and applied mathematics. Over time, I aim to produce a comprehensive series of videos and collections of graphic visualisation tools, constructing a dedicated interactive learning platform that revolutionises economics pedagogy.
If you have ever felt the limitations of traditional educational resources or found yourself seeking more dynamic, interactive ways to learn or teach, I invite you to follow my social media channels and stay tuned for the future release of my e-book. I welcome you to share your experiences, insights, and critique in the comment section below. Your feedback will be invaluable in shaping the future of this initiative. As this project evolves, I aim to continually push the boundaries of conventional pedagogy, ultimately creating an interactive learning space that encourages intuition, problem-solving, and critical thinking. A platform where learning economics becomes a journey of discovery and curiosity, fuelled by the transformative power of the Wolfram Language.
II. Contemporary Challenges in Economics Pedagogy
II. Contemporary Challenges in Economics Pedagogy
In today’s age of digital revolution, conventional teaching and learning methodologies can fall short of engaging students and equipping them with the necessary intellectual tools. This issue is particularly poignant within economics, where static lecture material may fail to fully depict the subject’s complexity and dynamic nature.
With its heavy reliance on textbooks and written materials, traditional economics pedagogy provides fixed representations of models and theories. While these resources are comprehensive, they frequently struggle to capture the interplay of variables, equilibria, and functions that form the fabric of economic comprehension. Diagrams, intended as aids for navigation through dense economic concepts, can paradoxically add to the confusion rather than alleviate it. As a result, students often resort to memorisation, inhibiting the development of instinctive economic understanding. This learning approach can make economics appear abstract and disconnected from real-world applications, potentially leading to student disengagement.
Furthermore, motionless resources do not permit students to visualise the ‘what if’ scenarios, the potential shifts in equilibrium resulting from changes in model parameters. Students lack the opportunity to actively manipulate these variables and observe the effects, depriving them of a rich, immersive learning experience. This limitation can hinder the cultivation of crucial cognitive skills such as critical thinking, which is pivotal not only within the study of economics but also in wider professional life.
Here, the potential of interactive education through graphic visualisation tools coded in the Wolfram Language becomes evident. The Language’s dynamic capabilities and intuitive syntax become ideal mediums for bringing economics to life, particularly through the Manipulate function. Interactive resources encourage active learning, allowing students to modify variables in economic models and witness the resulting changes in real-time. This not only nurtures an intuitive understanding of economics but also hones critical thinking skills. By witnessing the dynamics of these models firsthand, students can better grasp the complexities of economics, enhancing their ability to apply this knowledge in diverse scenarios.
Moreover, using software-based learning tools encourages a transition from passive consumption of knowledge to active exploration. This approach enhances understanding, fosters curiosity, and instils a deeper appreciation for the subject. Consider a simple supply and demand model. Using the Wolfram Language, students can manipulate variables such as the cost of production or consumer income and see how these changes affect the equilibrium price and quantity. This hands-on approach offers a powerful illustration of economic principles at work. Adopting the Wolfram Language not only aligns with the expectations of the digital era but also provides a more faithful representation of economics through which greater teaching potential can be attained.
Overall, modernising economics pedagogy through interactive learning tools promises students a vibrant and enriching journey. It paves the way from abstract theory to practical comprehension and application, fostering a generation of learners well-versed in the complex landscapes of economics.
III. Approach and E-book Structure
III. Approach and E-book Structure
My e-book intends to make economics and applied mathematics accessible to beginners by emphasising intuitive understanding over technical terms. This will be accomplished through interactive animations coded using the Manipulate function, enabling the reader to visualise and engage with real-life scenarios while highlighting key economic intuition. The e-book’s overall tone avoids technical jargon, refers to real-world examples, and aims to implement a light, engaging narrative.
Distribution avenues include sales to educational institutions, leveraging my growing YouTube channel @AnguloLIVE for promotion and explanation, and making the content available for download via the Wolfram Player App in the App Store. Further discussions regarding distribution, marketing strategies, and action plans are on due course.
After careful consideration and planning, the following is an outline of the tentative structure and contents of the e-book (subject to further changes):
1. Introduction
1. Introduction
Brief overview of:
◼
the e-book’s purpose.
◼
its contents.
◼
how it intends to help the reader.
◼
the value of learning economics through interactive software.
2. Training Our Minds
2. Training Our Minds
Presenting pillars of economic intuition to understand the rest of the book, with the devised structure for each chapter.
◼
context.
◼
example problem.
◼
interactive animation.
◼
real-life applications.
One or two more relevant chapters may be added later on.
2.1 A World of Incentives
2.1 A World of Incentives
Explaining how different incentives yield economic equilibria in dynamic environments.
2.2 The More May Not Be the Merrier
2.2 The More May Not Be the Merrier
Outlining the inner-workings of resource allocation for multivariate optimisation.
2.3 Gamblers and Bankers
2.3 Gamblers and Bankers
Differentiating risk-seekers from risk-evaders when having to make choices under uncertainty.
3. Microeconomics
3. Microeconomics
Section dedicated to chapters on microeconomics topics and interactive animations representing each key concept (further subtopics may be added).
3.1 Welfare Economics
3.1 Welfare Economics
◼
Surplus and market equilibrium.
◼
Pareto efficiency and Edgeworth boxes.
3.2 Game Theory
3.2 Game Theory
◼
Best-responses.
◼
Dominant strategies.
◼
Nash equilibria.
4. Macroeconomics
4. Macroeconomics
Section dedicated to chapters on macroeconomics topics and interactive animations representing each key concept (further subtopics may be added).
4.1 Composition of GDP
4.1 Composition of GDP
◼
Closed economies.
◼
Open economies.
4.2 International Balance
4.2 International Balance
◼
Trade and current account balances.
◼
Investment positions.
5. Econometrics
5. Econometrics
Section dedicated to chapters on econometrics topics and interactive animations representing each key concept (further subtopics may be added).
5.1 Cross-sectional Data
5.1 Cross-sectional Data
◼
Correlation vs causality.
◼
Forecasting.
5.2 Time Series
5.2 Time Series
◼
Time trends, seasonality, and cycles.
◼
Autocorrelation and partial autocorrelation functions.
6. Your Time to Shine
6. Your Time to Shine
Recapitulating ideas and concluding the e-book’s message:
◼
what to expect from an undergraduate economics degree (mathematically and analytically).
◼
revision strategies for exams
◼
invitation to my social media channels for education.
7. For the Future Nobel Economist
7. For the Future Nobel Economist
An additional section for those readers interested in getting equipped withe crucial mathematical methods for undergraduate economics material. Undergraduate-level questions with solutions, interactive graphs for visualisation, and walkthrough videos on YouTube @AnguloLIVE.
7.1 Preparation for University
7.1 Preparation for University
◼
Partial differentiation and bivariate functions: first-order conditions and the Lagrange method.
◼
Statistical terms: interpreting statistical tables, and OLS regression estimates.
7.2 Microeconomics
7.2 Microeconomics
◼
Consumer theory: maximising a consumer’s utility subject to a budget constraint.
◼
Game theory: visualisation and classification of Nash Equilibria encompassing pure and mixed strategies.
7.3 Macroeconomics
7.3 Macroeconomics
◼
Closed-economy equilibrium: computing the equilibrium level of GDP from functions of consumption, investment, and government expenditure.
◼
Two-period small open economies: visualisation and classification of Nash Equilibria encompassing pure and mixed strategies.
7.4 Econometrics
7.4 Econometrics
◼
Hypothesis testing: significance of coefficients from multivariate regressions and confidence intervals.
◼
Partial and total period responses: calculating long-run responses of a dependent variable to a shock in the explanatory variable at time .
y
x
t
IV. Producing the Interactive Animations
IV. Producing the Interactive Animations
Find here a few samples of interactive code that I produced to be part of my e-book (all subject to further improvements/changes). Samples 2.1, 2.2, and 2.3 correspond to chapters within section 2, ‘Training Our Minds’, which explores key areas of economic intuition to understand the rest of the book. Parts A and B of sample 7.2 correspond to a chapter within section 7, ‘For the Future Nobel Economist’, which provides keen readers with additional material to learn some core mathematical methods for economic analysis to practice for their undergraduate studies.
Sample: 2.1 A World of Incentives
Sample: 2.1 A World of Incentives
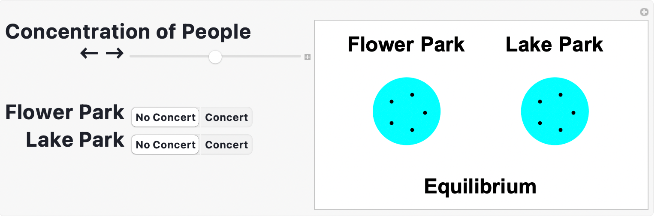
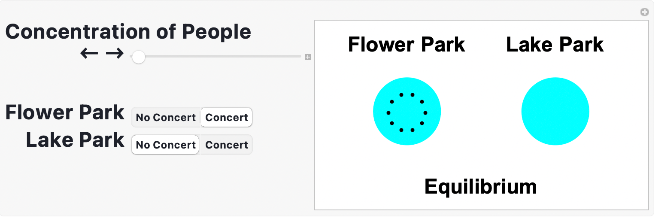
The Manipulate code (Appendix 1) creates an interactive visualization depicting the distribution of people between two parks, “Flower Park” and “Lake Park”, depending on whether a concert is held in them. The user can manipulate the intensity of the concerts in both parks through sliders, causing a change in the crowd concentration. As the concentration of people changes, so do the colors of the circles representing the parks. These circles shift through shades of red, cyan, and green to indicate the crowd’s concentration level. Inside the circles, points are plotted to represent individuals. An equilibrium state, when crowd concentrations in both parks are equal, is also recognized and labeled accordingly. If the colors of the two circles match, the program designates this state as “Equilibrium”. Otherwise, it’s labeled as “Disequilibrium”. The purpose of this code is to provide a vivid, interactive representation of how various factors can affect crowd distribution in real-world settings. Here are three snapshots showing different output possibilities of the finalised interactive animation for this chapter’s example of equilibria subject to changing environmental conditions:
Sample: 2.2 The More May Not Be the Merrier
Sample: 2.2 The More May Not Be the Merrier
This Manipulate code (Appendix 2) generates an interactive 3D plot of a quadratic function, depicting a curved surface in a specific region of the 3D space. It allows the user to manipulate the position of a red sphere on this surface using two sliders: one horizontal and one vertical. These sliders control the ‘left-right’ and ‘backward-forward’ movement of the sphere. The color of the surface changes depending on the z-value (down-up), providing a visual representation of the function’s value. These are three snapshots showing different output possibilities for the finalised interactive animation for this chapter, simplifying the process of unconstrained multivariate optimisation:
Sample: 2.3 Gamblers and Bankers
Sample: 2.3 Gamblers and Bankers
This Manipulate code (Appendix 3) creates an interactive visual decision tree and associated controls, demonstrating the potential profits of producing a standard film vs. an experimental film. The experimental film has variable outcomes (success/failure), with associated probabilities. User can manipulate profits and probabilities to visualize changes in expected returns. The graphics part shows the decision tree, while the grid part displays the controls for the respective profit parameters and their probabilities. The code also calculates and displays the expected profit for the experimental film. Here are three snapshots showing different output possibilities of this chapter’s interactive animation for Quentin’s decision tree and expected value calculations:
Sample: 7.2 Microeconomics
Sample: 7.2 Microeconomics
Part A: Consumer Theory
Part A: Consumer Theory
This problem can also be solved through the first-order conditions of the Lagrangian expression:
Hence, the solutions are:
Hence, the solutions are:
◼
Hicksian Substitution Effects:
◼
Hicksian Income Effects:
◼
Hicksian Total Effects:
Differentiating from the currently available tools in the Wolfram Demonstrations Project, a Manipulate code (Appendix 4) was produced to represent (1) iso-utility functions showing optimised levels of consumption subject to different budget constraints from the Hicksian approach, (2) consumption levels and Hicksian effects solutions, and (3) utility and disposable income levels. The Association, Dataset, and Epilog functions are fundamental features of the code. These are three snapshots showing different output possibilities of the interactive visualisation tool for graphic and numeric calculations for constrained multivariate optimisation in consumption:
Part B: Game Theory
Part B: Game Theory
Part B of chapter 7.2 will present the formulation of the Normal Form of a 2x2 game (2 players, each can play 2 different strategies), in which one could find Mixed Strategy Nash Equilibria for the game matrix in the form (Harkins, 2021):
This game matrix has Mixed Strategy Nash Equilibria solutions
Differentiating from the currently available tools in the Wolfram Demonstrations Project, a Manipulate code (Appendix 5) was produced to represent (1) the normal form of a 2x2 game, (2) the Mixed Strategy Nash Equilibrium solutions, and (3) the graphical plot of each player’s best response functions. The Association, Dataset, and Epilog functions are fundamental features of the code. Here is the interactive visualisation tool for numeric computations and graphic representation of Mixed Strategy Nash Equilibria:
V. Writing Sample: Chapter 2.1, ‘A World of Incentives’
V. Writing Sample: Chapter 2.1, ‘A World of Incentives’
The economic terminology we stumble upon in our daily lives is fundamentally rooted in the extent to which our individual decisions are affected by our ever-changing world. Demand, supply, growth, prosperity, and unemployment are all the cumulative results of the choices made by people and organisations, like grains of sand on a beach. These visible outcomes are propelled forward by unseen forces: incentives, crucial elements that motivate and influence our behaviour. They lie at the heart of economic decision-making, shaping the actions of individuals, businesses, and even entire nations. Silent whispers that nudge our decisions in one direction or another. Invisible hands that mould our behaviour and direct our actions. Subtle and omnipresent, incentives have quietly choreographed the dance of civilisations since time immemorial. Economists, philosophers, and social scientists have all recognised their value, yet they remain largely unappreciated in our daily lives. From a child’s yearning for a golden star on a school assignment to a CEO’s ambition for market dominance, incentives come in all shapes and forms. They can be tangible, like financial profit and trophy prizes, or intangible, like social recognition and personal satisfaction. They can be positive, encouraging a certain action, or negative, deterring it. Regardless of their form, they all serve the purpose of motivating and influencing our behaviour.
However, the impact of incentives extends beyond the individual. Every incentive-induced decision feeds into societal behaviour, creating currents of action that push and pull economic outcomes. As these individual choices align, a balance between driving and restraining forces is attained where everyone acts according to what they see fit, affecting some for the better and others for the worse. Thus, people aim to optimise their decisions, from which any deviations would yield less desirable results. This is an economic equilibrium, a dynamic rather than a static concept due to life’s constant changes. Alterations in our perspectives and ambitions can cause ripple effects, prompting us and others to reassess our choices, pushing society towards a new equilibrium. It’s a ceaseless dance of transformation, powered by the push and pull of motivations, shaping the course of societal progression. Hence, we find ourselves in a complex symphony of actions and reactions where incentives and individual decisions constantly reshape each other.
Let’s picture two lively parks in the heart of our city: Flower Park and Lake Park. Each is an illustrious oasis that people admire equally. They do not mind which they visit as long as it is either of them, thus distributing themselves evenly between these two parks. Envision this as our starting setting, an equilibrium of uniformity where people are quite content with visiting either. But let’s stir the pot a little. Suddenly, a concert featuring a world-renowned music band is announced at Flower Park. Almost instinctively, people flock to the venue since the musical spectacle acts as an incentive, nudging individuals not to visit Lake Park. Something similar would happen if the concert were announced at Lake Park instead, leaving Flower Park relatively deserted. Now let’s add a twist. In response to Flower Park’s advertisement, Lake Park announces a grand concert featuring another world-famous music band set to rival the spectacle at Flower Park. This incentive draws back visitors to Lake Park, re-establishing a semblance of the initial equilibrium of uniformity. These dynamics are the dance of incentives, always subject to our environment’s ever-changing nature, a testament to how they shape and reshape our economic realities.
Now, let’s take a closer look at these dynamics using the interactive animation below. Use the sliders to control the concentration of people in each park and their possible concerts. Equal colours mean equilibrium, as people naturally decide which park to visit according to the various concert possibilities. Different colours represent disequilibrium since relocating from one park to another has potential benefits. Explore the equilibrium and disequilibrium possibilities by controlling the slider for the concentration of people.
By altering the musical attractions of each park, you will see how economic equilibria do not imply equality but equity to different extents according to what people find to be in their best interest. Incentives are embedded in all facets of our lives, from the books we read and the jobs we choose to the parks we visit and the personalities we develop. While we’ve explored them through our imaginative journey of park visitors and music concerts, they cast a wider, more influential net on our everyday decisions. Of course, in reality, the problem will not be as simple under more variant circumstances. What would happen if visitors strongly desired to visit one of the parks in particular? What if they faced transportation costs from one park to the other which they are unable or unwilling to bear? Could many visitors not find either music band to be their cup of tea? How could locals have different park-visiting attitudes than tourists? Or how could external factors, such as weather or political manifestations, affect willingness and capacity of attendance? These are complex questions; the tools to answer them await in the coming chapters.
As we’ve learned, incentives produce individual choices continuously, dynamically shaping society’s economic equilibria in an ever-evolving panorama of change. Interestingly, this process thrives when we know how to balance our utilisation of resources. Too many elements can lead to uncontrolled chaos rather than sustainable harmony. This principle applies to the resources we use for consumption and production in our daily lives, whether we are buyers or firms. As we’ll explore in the next chapter, while we often aspire for ‘more’ of what we desire, it’s crucial to grasp that ‘more’ might not always imply ‘better’. In the world of economics, the quest for balance, not excess, is vital to maximising efficiency and welfare. In order to progress in our learning adventure, we need to understand very well how much is just right and when ‘more’ becomes ‘too much’.
VI. Concluding Remarks
VI. Concluding Remarks
Progress in this project has been methodical and careful, yielding promising initial results and insights for the future. The narrative and structure of the e-book were devised, providing comprehensive guidelines for me to continue producing intuitively engaging content. The use of the Wolfram Language, particularly through the Manipulate function, enabled the creation of captivating interactive animations, breathing life into the economic models. A full draft for section 2 of the e-book was written, including three chapters on core economic principles.
Always eager to improve, several areas for further refinement in this project and optimisation in its code have been identified. It is crucial to pay close attention to continually enhancing the clarity of written explanations, ensuring that both economic concepts and interactive code are easily understandable. Furthermore, optimising the use of the Pane function for better ImageSize adjustments could be explored to prevent slight movements in the output (this is currently happening in chapter 2.3’s Decision Tree; a minor issue, but potentially rewarding to address). Likewise, the presentation of labels and the efficient use of white space can certainly be improved. These are opportunities rather than obstacles, spurring the my curiosity and dedication to making this interactive educational tool even more effective and engaging.
VII. Future Work
VII. Future Work
Moving forward, the immediate focus is on completing the e-book’s sections with additional economic models and insightful explanations while enhancing the interactivity of existing ones. Leveraging the feedback from the initial audience, the content will be further improved, making it more intuitive and user-friendly.
In the long term, the goal is to expand beyond the realm of the e-book. I intend to collaborate with educational institutions and teachers worldwide to integrate the Wolfram Language into their economics curriculum, creating a holistic learning experience. The specific logistics of distribution avenues are yet to be specifically defined. Moreover, I aim to further develop my own platform, where students and educators can share, download, and collaborate on interactive economic models, fostering a vibrant community of dynamic learners.
This journey has just begun. The horizon of possibilities to revolutionise economics pedagogy with the Wolfram Language is immense. It is truly an exciting path towards shaping the economics education of tomorrow.
Keywords
Keywords
◼
Economics
◼
Interactive Learning
◼
Education Innovation
◼
Comparative Statics
◼
Constrained Optimisation
◼
Game Theory
◼
Manipulate
◼
Community Impact
◼
Content Creation
Acknowledgment
Acknowledgment
I wish to express my deep gratitude to Mads Bahrami and the team at Wolfram Research for offering me full financial support for 2023’s Summer School. This experience has profoundly shaped my professional aspirations and enabled me to tackle larger and more ambitious projects.
My sincere thanks also extend to Daniel Robinson and Paul Abbott. Their invaluable guidance, continuous encouragement, and insightful advice have significantly enhanced my coding proficiency and allowed me to address areas for development.
I would also like to express my heartfelt appreciation to my Undergraduate Research Support Scheme supervisor, Dr Andrew Harkins, and Professor Caroline Elliott, both at the University of Warwick’s Department of Economics. Their unwavering support and encouragement throughout my journey have been instrumental in propelling me towards my goals.
Furthermore, none of my work would be possible without the unconditional support from my beloved family and closest friends. Their encouragement, patience, and understanding have been my pillars of strength, allowing me to reach new heights.
Finally, I want to thank Stephen Wolfram, whose pioneering work in creating and expanding the boundaries of the Wolfram Language has inspired countless learners and thinkers, myself included.
References
References
◼
[1] C. Angulo, “Creation of Wolfram Visualisation Tools for Microeconomic Pedagogy in Comparative Statics”, Undergraduate Research Support Scheme research paper, University of Warwick, UK, 2022.
◼
[2] A. Harkins, “Topic 10 - Nash Equilibrium (part 2)”, Microeconomics 1 (EC109) Lecture Material, University of Warwick, UK, 2022.
◼
[3] K. Sydsæter, P. Hammond, A. Strøm and A. Carvajal, Essential Mathematics for Economic Analysis, 6th ed., Hoboken, NJ: Pearson, 2021.
Appendix
Appendix
1. Interactive (Manipulate) Code for Chapter 2.1
1. Interactive (Manipulate) Code for Chapter 2.1
2. Interactive (Manipulate) Code for Chapter 2.2
2. Interactive (Manipulate) Code for Chapter 2.2
3. Interactive (Manipulate) Code for Chapter 2.3
3. Interactive (Manipulate) Code for Chapter 2.3
4. Interactive (Manipulate) Code for Chapter 7.2 Part A
4. Interactive (Manipulate) Code for Chapter 7.2 Part A
5. Interactive (Manipulate) Code for Chapter 7.2 Part B
5. Interactive (Manipulate) Code for Chapter 7.2 Part B
CITE THIS NOTEBOOK
CITE THIS NOTEBOOK
Shaping the future of economics education: an undergrad's venture into interactive pedagogy
by Carlos Angulo
Wolfram Community, STAFF PICKS, July 12, 2023
https://community.wolfram.com/groups/-/m/t/2959154
by Carlos Angulo
Wolfram Community, STAFF PICKS, July 12, 2023
https://community.wolfram.com/groups/-/m/t/2959154