Plot a two functions and the ticks and gridlines are useful.
In[]:=
Plot[{Sin[x],100Cos[x]},{x,0,6Pi},GridLines->Automatic]
Out[]=
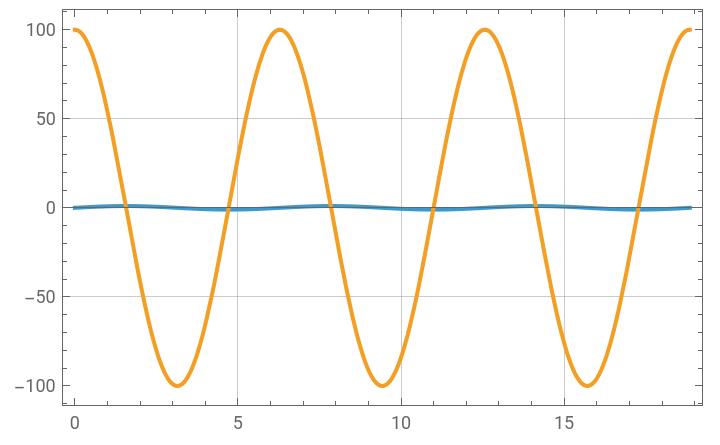
Plot two functions for the purpose of comparing data of different ranges and 1) ticks are gone and the gridlines are misaligned, and 2) both functions are plotted to y-ranges that are chosen to accommodate the larger range, making it still impossible to see the detail in one.
In[]:=
Plot[{Sin[x],100Cos[x]},{x,0,6Pi},PlotLayout->"Column",PlotRange->Full,GridLines->Automatic]
Out[]=
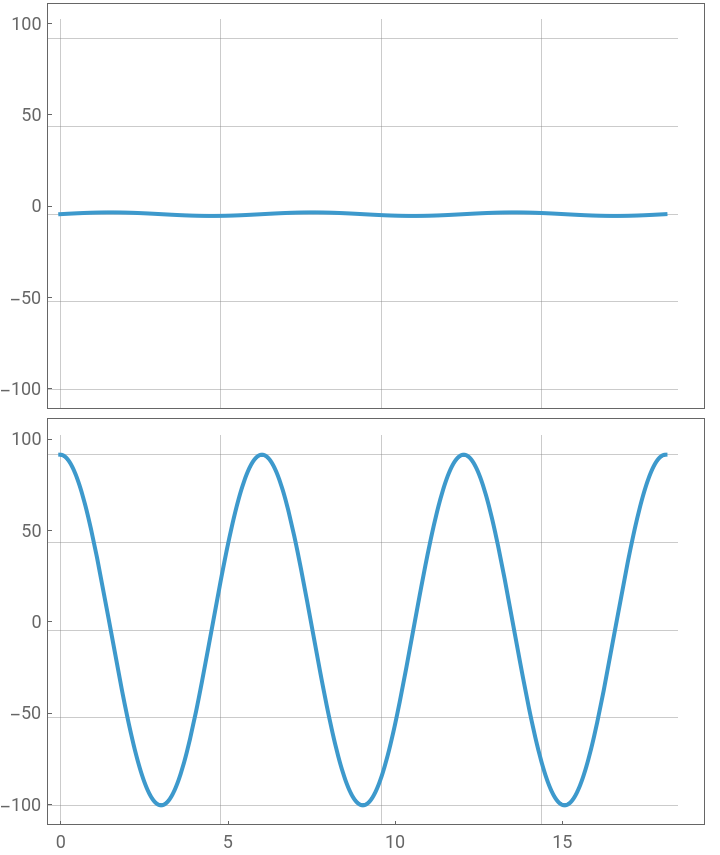
This issue occurs for ListPlot and DateListPlot as well. When I am aligning plots column-wise like this it is most often for the purpose of comparing data sets which have very different dynamic ranges. The one-range-for-all makes this useless, and the misaligned gridlines are a nuisance.