The Japanese series Science Fell in Love, So I Tried to Prove It (in Japanese: 理系が恋に落ちたので証明してみた。) is a romantic comedy drawn and written by Yamamoto Alfred. It centers around a group of graduate students studying at Saitama University, who attempt to apply various scientific and mathematical principles to their romantic situations, often with hilarious (and sometimes heartwarming) results. The series title is a bit long, so hereafter, I will be using its portmanteau series nickname "RikeKoi".
For this notebook, I wanted to point out RikeKoi’s use of various equations representing a heart-shaped curve. Some of these are already listed in the MathWorld page for heart curves, but some seem to be new.
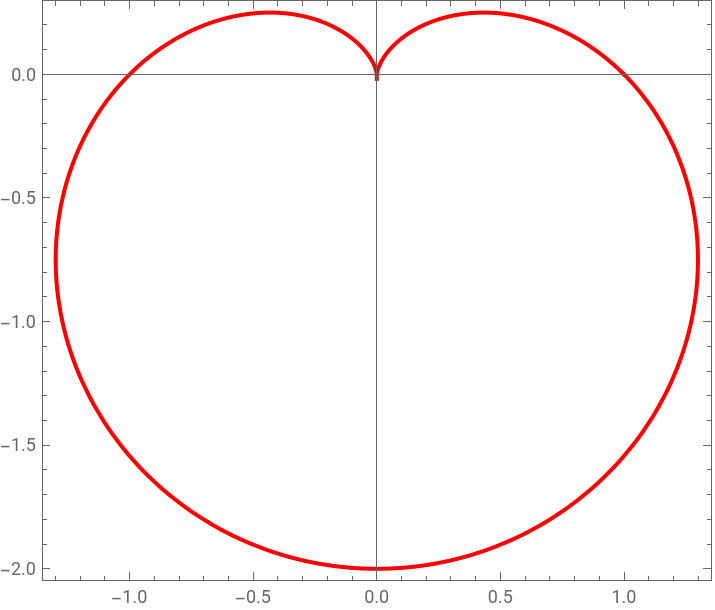
As a warmup, consider the heart-shaped curve that was used in the logo for the second season of the anime adaptation:
PolarPlot1-Sin[θ],{θ,0,2π},
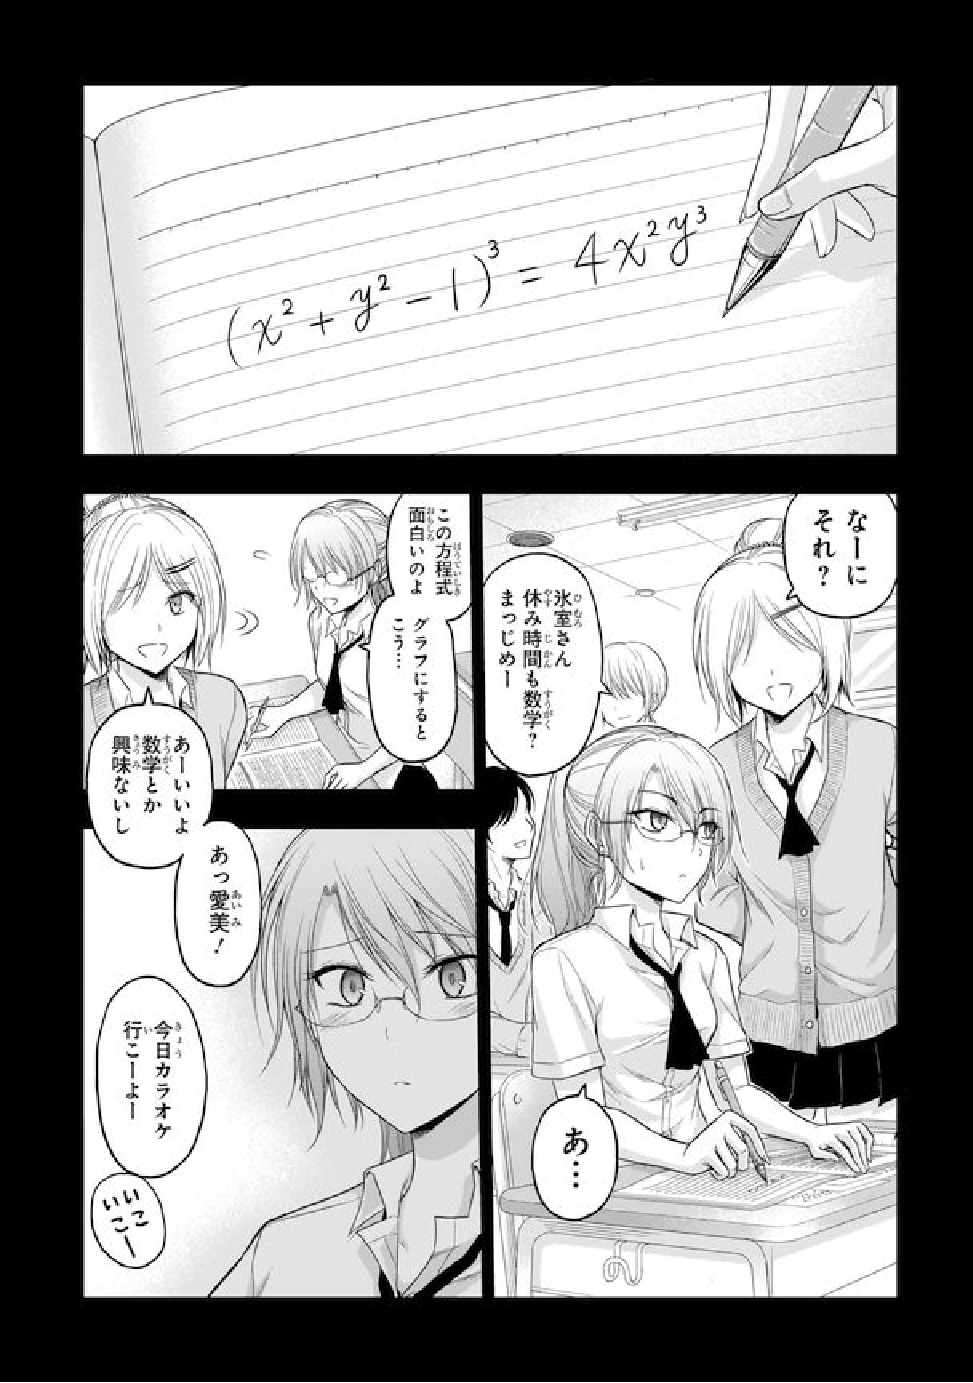
The curve with the implicit Cartesian equation in Himuro's flashback, which she then presented to her colleague (and love interest) Yukimura in the present day, can be visualized using ContourPlot:
ContourPlot(x^2+y^2-1)^3==4x^2y^3,{x,-Sqrt[2],Sqrt[2]},y,-1,,

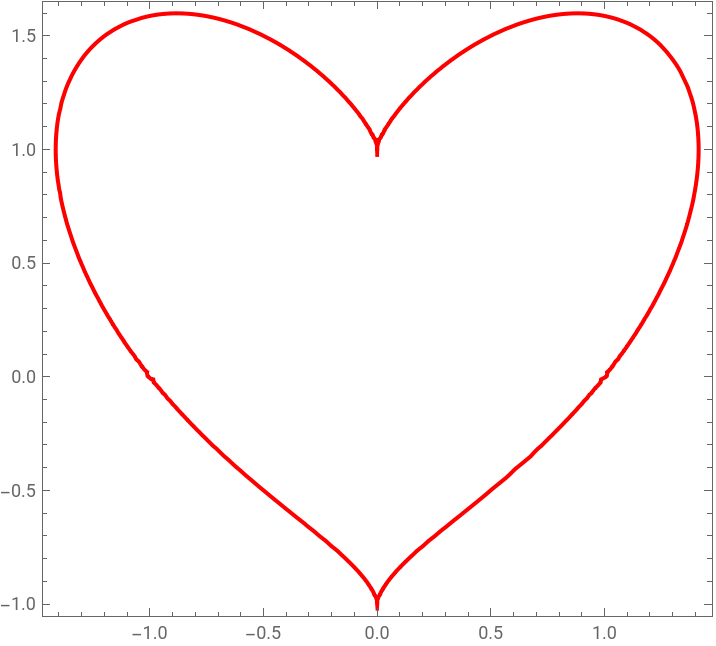
ContourPlot{(x^2+y^2-1)^3==x^2y^3,(x^2+y^2-1)^3==4x^2y^3},{x,-Sqrt[2],Sqrt[2]},y,-1,,
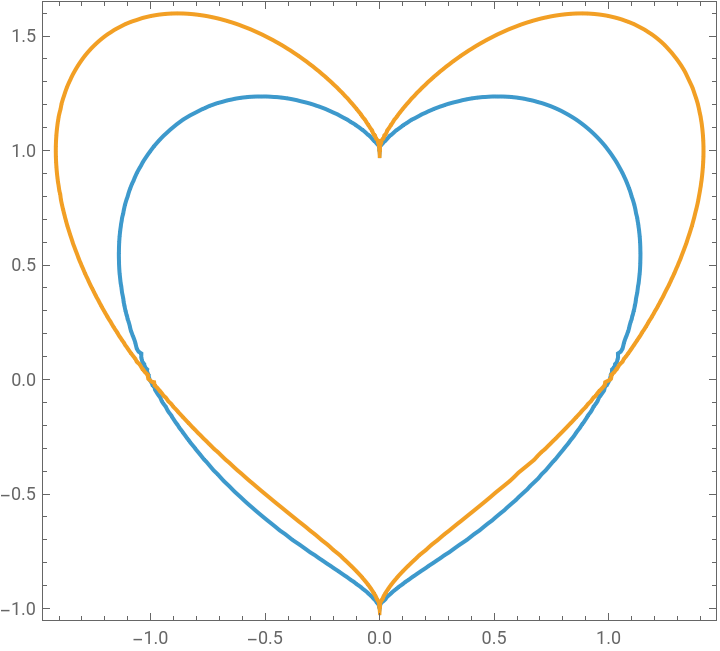


I personally find RikeKoi's modification to be slightly better proportioned than the original.
After that, we see a various succession of heart curves featured in the comic. For example, Yukimura gives a polar equation with a variable parameter, which was intended to represent a "beating" heart as the parameter is adjusted. Unfortunately, if we try to plot the equation as presented in the comic, the result is manifestly not heart-shaped:
With[{t=4.32},PolarPlot[(4+Sin[t])/Sqrt[1-Cos[θ]Sin[θ]],{θ,0,2π}]]
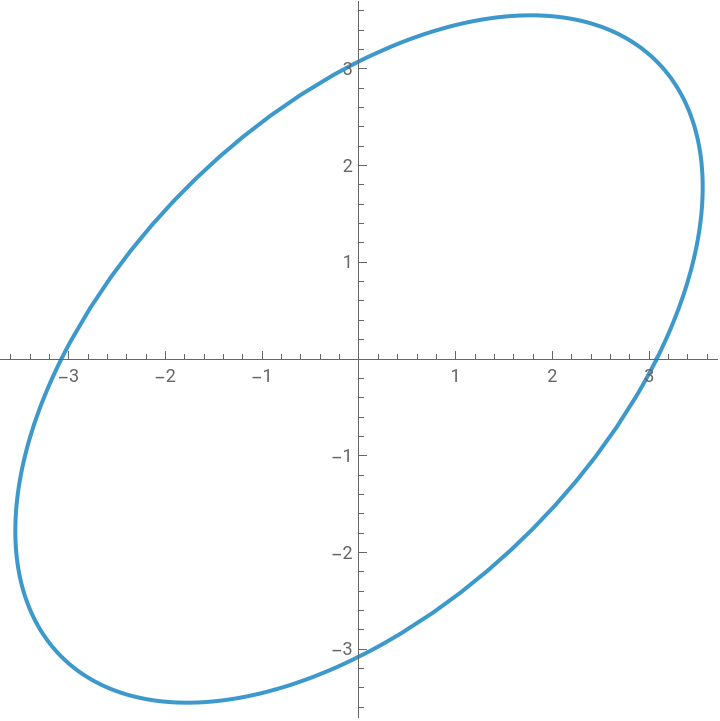
(Perhaps an enterprising soul can figure out how to fix Yukimura's attempt? ;) )
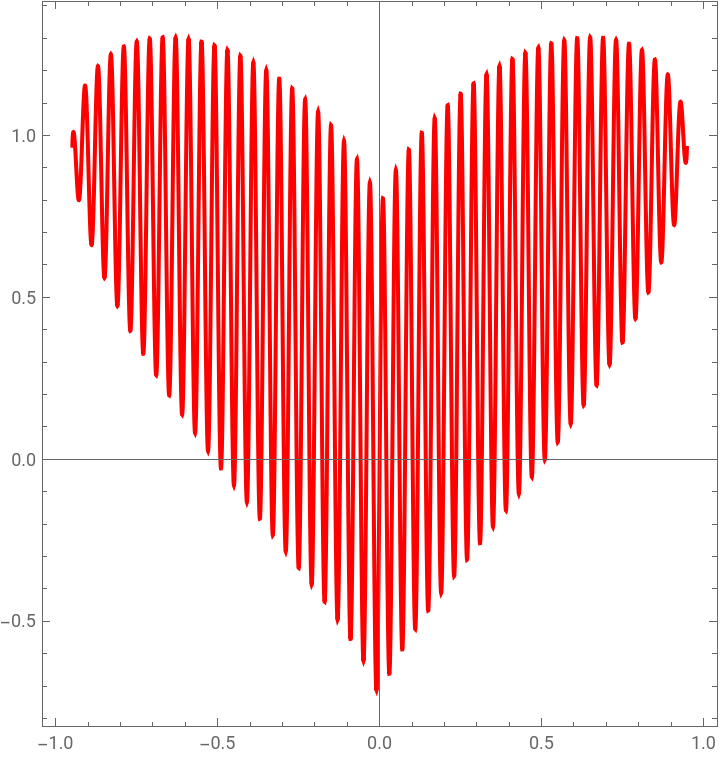
Ibarada's version is effectively a suitably damped and restricted sine wave, which gradually approximates a filled heart as the frequency of the sinusoidal term is increased. This is an appropriate time to use Manipulate along with Plot:
ManipulatePlotCubeRoot[x]^2+45Sqrt[9/10-x^2]Sin[aπx],{x,-1,1},,{{a,50},5,110}


Finally, Himuro, who seems to be showing off at this point, displays a rather elaborate inequality, which can be visualized with RegionPlot:
To me the chimeric nature of the inequality (i.e., multiple pieces of curves stitched together with Min and Max) gives off the same ad hoc, unsatisfying feel as the "Batman curve". (Perhaps part of this feeling is my frustration with inputting the inequality from the comic into a form suitable for Mathematica, which may have resulted in something different from what Himuro originally intended. Someone smarter than me with OCR stuff might have a better way to readily extract the inequality. :) ) At least, their academic adviser Ikeda was suitably impressed by this one.
Still, I do prefer Himuro's first one the most, but Ibarada's sine wave is a nice second-placer. In any event, I hope this has been a fun diversion, even though it came a little late for this year's Valentine's Day.
Still, I do prefer Himuro's first one the most, but Ibarada's sine wave is a nice second-placer. In any event, I hope this has been a fun diversion, even though it came a little late for this year's Valentine's Day.
CITE THIS NOTEBOOK
CITE THIS NOTEBOOK
Various heart-shaped curves from a Japanese series
by J. M.
Wolfram Community, STAFF PICKS, February 19, 2025
https://community.wolfram.com/groups/-/m/t/3396851
by J. M.
Wolfram Community, STAFF PICKS, February 19, 2025
https://community.wolfram.com/groups/-/m/t/3396851