ABSTRACT (original article): We explain the overall equilibrium-temperature-dependent trend in the exoplanet mass–radius diagram, using the escape mechanisms of hydrogen and relevant volatiles, and the chemical equilibrium calculation of molecular hydrogen (H) break-up into atomic hydrogen . We identify two Cosmic Hydrogen and Ice Loss Lines (CHILLs) in the mass–radius diagram. Gas disks are well known to disperse in ten million years. However, gas-rich planets may lose some or almost all gas on a much longer timescale. We thus hypothesize that most planets that are born out of a hydrogen-gas-dominated nebular disk begin by possessing a primordial -envelope. This envelope is gradually lost due to escape processes caused by host-stellar radiation. CITATION (original article): Li Zeng, Stein B. Jacobsen (2024), Cosmic hydrogen and ice loss lines, Icarus, Volume 414, 116033. https://doi.org/10.1016/j.icarus.2024.116033
()
H
2
H
2
The figure above is a planet Mass-Radius diagram in log-log scale. That means any contour of the form , Mass to the i-th power, divided by Radius to the j-th power, will show up as a straight line in this plot. Straight line is a sign of identifying a physical law according to Theodore von Karman. That const will then determine the intercept of the line. One important feature of this plot, is that observed exoplanets with precisely-measured RV masses do not exist everywhere in the full M-R parameter space. They seem to be confined by several of these characteristic boundary lines. Let’s discuss the possible origins of these lines.
(/)=const
i
M
j
R
M/R = const
M/R = const
In one sentence, it may arise from ordinary thermal atmospheric escape (boiling-off scenario).This is thought to have been caused by atmospheric escape process due to the host stellar irradiation. Because the capability of a planet holding onto volatile atmospheric gas species is proportional to the depth of its gravitation potential well at its surface, which is in energy unit of G*M/R per unit mass. Another way to take it is to equate the surface escape velocity, which is \Sqrt[2*G*M/R], to a certain multiple of the characteristic thermal velocity of a molecule or atom or ion, and call that a threshold of escape, and calculate the corresponding threshold escape timescale.
Why the line is shifted to the right for the gas giants, I think, is because gas giants’ atmosphere consists of mostly Hydrogen and Helium, while the smaller planets’ atmosphere may consist of significant heavier species. The Mean Molecular Weight (MMW) will thus make a difference.
M/R^1.5 = const or equivalently, M^2/R^3 = const
M/R^1.5 = const or equivalently, M^2/R^3 = const
In one sentence, it may arise from collisional stripping, or, rotational breakup, or both. Our first insight was that this physical boundary on the mass-radius plot is caused by a physical threshold in giant impact/collision/merging scenario. In such a scenario, if two colliding bodies (of similar sizes) are too massive, then the collision may turn out to be energetic enough and become catastrophic, and lead to mass loss instead of mass gain. This is similar to what we had theorized for Mercury formation scenario in our own solar system.
M^2/R^3 is the total kinetic energy (which arises from their mutual gravitational attraction, and thus, equal to their mutual gravitational energy at the length scale of their radii). Another possibility is rotational breakup. Since according to planet formation theory, planets would acquire significant angular momentum from the gas disk where they are born from, and spin relatively fast initially. (Part of this spin may then be due to non-head-on collision with other planetary bodies). This spin, if it exceeds a certain threshold, may prevent further accretion of materials, because M^2/R^3 is also the gravitational binding energy of the planet itself.
Orbital Decay (M^(1/5~1/6) * R^1 = const, roughly)
Orbital Decay (M^(1/5~1/6) * R^1 = const, roughly)
The physical boundary defines upper right boundary of puffed gas giants, likely due to orbital decay. For gas giants orbiting very close to their host stars, two things may occur: (1) they puff up, that is, they become larger to have larger radii when placed closer to the host star, due to the absorption of host stellar photons and conversion of that into internal heat and entropy; and (2) their orbit would gradually decay, that, spiral in and may eventually end up falling close enough to its host star and be destroyed.
This in-spiral process depends, among many factors, on the mass of the planet, because the more massive the planet is, the larger tides it would raise in stellar interior and dissipates its orbital energy faster. This in-spiral process seems to be a relatively sharp threshold, which means that a planet can either survive almost forever or fall onto the star in a short timescale.
Therefore, generically speaking, one expects an anti-correlation between the planet’s mass and the planet’s radius, that is, a negative slope of this threshold of their survivability in orbital decay in the lgM-lgR plot. The exact index of this power-law, will depend on (1) how exactly a giant planet puffs up with increasing amount of host stellar irradiation, and (2) the exact timescale of orbital decay as a function of planet mass, stellar mass, Quality Factors Q , and orbital distance. If (1) and (2) are power-laws, then the resulting relation would be a power-law as well.
Cut-offs
Cut-offs
M*R^1.5 = const, or equivalently, M^2*R^3 = const
M*R^1.5 = const, or equivalently, M^2*R^3 = const
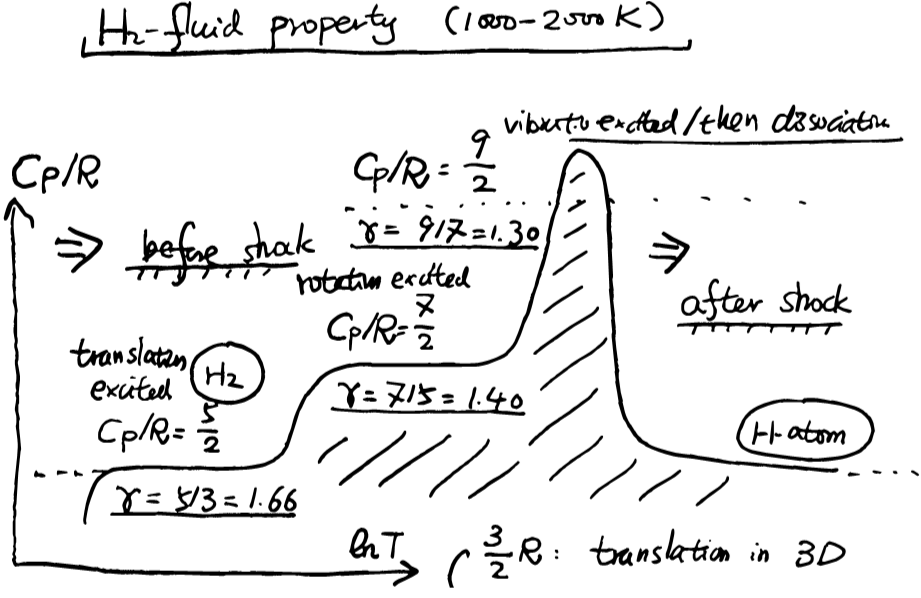
In one sentence, it may arise from a critical phase transition scenario, that is, a shock-wave-driven escape scenario due to the phase transition from H2-> H+H. More specifically, molecular dissociation of hydrogen (H-H) and other hydrides (X-H), and the subsequent escape of neutral H-atom into space. All of these are due to the absorption of host-stellar photons, and subsequent heating, molecular dissociation, and acceleration.
It is important to make a distinction between the escape scenario of hydrogen with that of helium. Since the former (hydrogen) likely undergoes a phase transition from H2-> H+H to facilitate the escape process, it likely involves a critical scenario under a critical host-stellar flux level, a shock-wave driven escape scenario. While the latter (helium) as an inert gas species will never undergo any kind of phase transition, more like a boiling-off scenario.
The two cut-offs are identified and explained below.
And hot-Neptune desert
And hot-Neptune desert
If one imagines that planets in between 2 and 6 Earth radii are huge natural reservoirs of molecular hydrogen, then when these reservoirs are subject to host-stellar irradiation, their stability is a key question to probe. The boundary is denoted as the thick red curve in the Rp-f subplot. Note there are several outliers which are potential candidates for future observations, which might arise from a combination of physical processes including migration, mass loss, and/or water worlds.
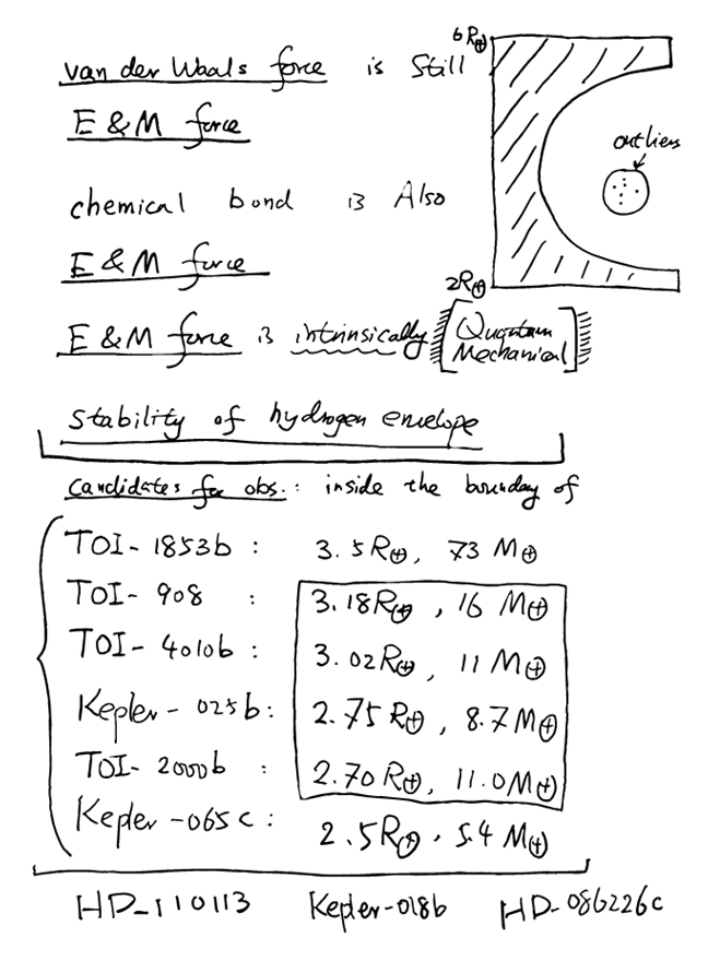
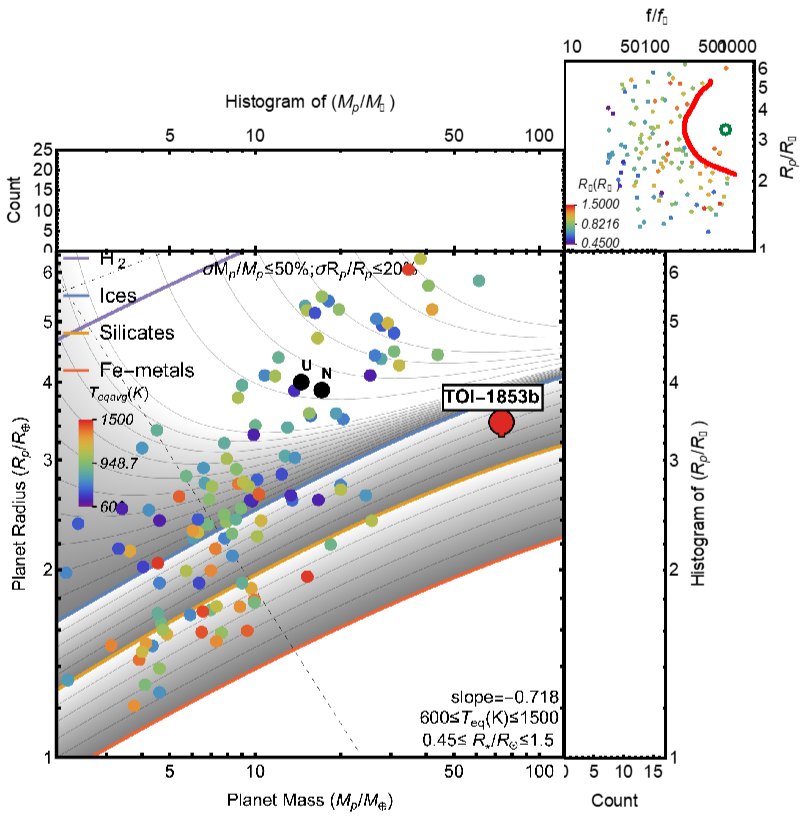
T_eq ~ 1000 Kelvin for small exoplanets: (M_p/10M_earth)^2 * (R_p/2R_earth)^3 =1.
This is the vertical tangent of the inner edge of the hot-Neptune desert, as denoted by the thick red curve in the Rp-f subplot. Moreover, if we assume that mother nature prepares us with all sizes of planets at all sorts of orbital distances, then, this inner edge is due to the intrinsic stability of the hydrogen envelope subject to host-stellar photons at ~200 times flux_earth.
This is the vertical tangent of the inner edge of the hot-Neptune desert, as denoted by the thick red curve in the Rp-f subplot. Moreover, if we assume that mother nature prepares us with all sizes of planets at all sorts of orbital distances, then, this inner edge is due to the intrinsic stability of the hydrogen envelope subject to host-stellar photons at ~200 times flux_earth.
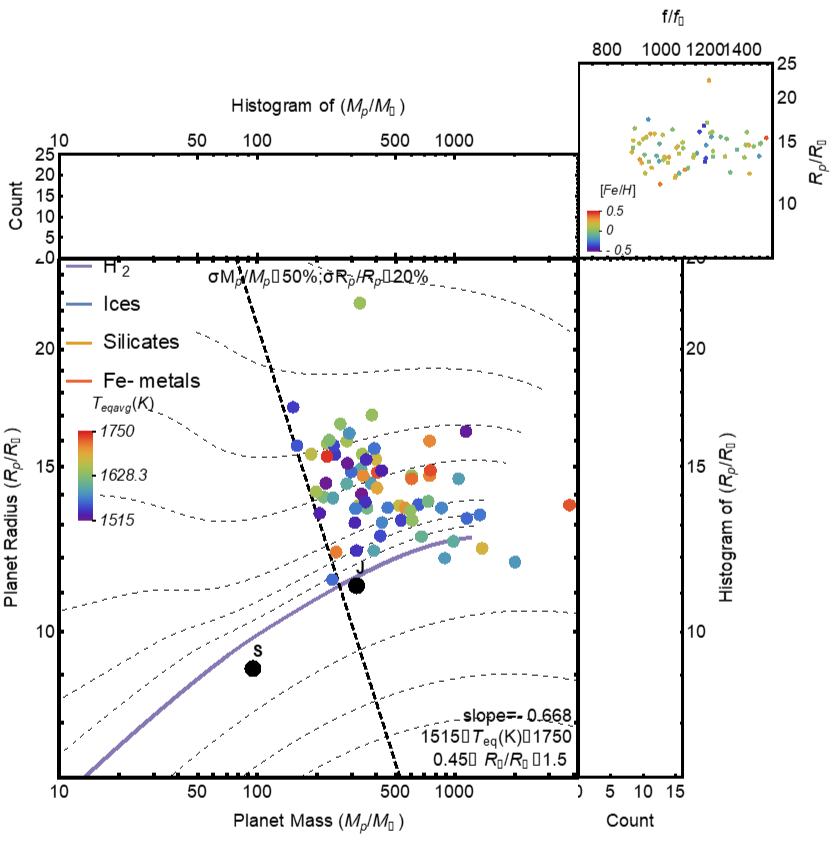
T_eq~1500 Kelvin for giant exoplanets: (M_p/300M_earth)^2 * (R_p/10R_earth)^3 =1. Gas giants have stronger gravity, however, similar cut-off with the same negative slope is identified, though being located at a higher flux-level ~800 times flux_earth.
Now, let’s visualize a planetary surface rich in H2 or H2O subject to host-stellar photons’ bombardment. When we tune up the photon flux, both the dissociation front and the (trans-)sonic front would push deeper into the planet fluid body, but at somewhat different paces. Under low-flux, the sonic front always lies higher above. However, under higher flux, the sonic front would quickly catch up with the dissociation front. When they touch, it would lead to the formation of a shock front. Thus, this leads to the emergence of a critical phenomenon at a critical photon flux level. Essentially, this creates a planetary-scale rocket engine.
shock-wave driven escape mechanism: Three fronts (transonic front, collisional front, and dissociation front) would merge into one shock front (a trinity!) to drive a beamed outflow.
The transition from ordinary thermal escape scenario to shock-driven escape scenario, corresponds to the rotation of the boundary from positive to negative slope in lgMp-lgRp space.
Application Interface
Application Interface
Application code
Application code
Set the working directory to notebook directory
Define exoplanet Data from Tepcat (updated on 05/30/2024, https://www.astro.keele.ac.uk/jkt/tepcat/)
#[[1]]: Planet_Name
#[[5]]: FeHdex
#[[21]]: eccentricity
Mass-Radius Curves
Mass-Radius Curves
Import some mass-radius curves of isentropic pure-Hydrogen composition, calculated from the Hydrogen-EOS in Becker et al. ApJS 215,21 (2014). Mass-radius curves of the "isentropic" pure-Hydrogen compositions are added as an option here,particularly useful for the gas giant exoplanets such as those hot jupiters. "isentropic" here means that we assume the specific entropy within the gas envelope from its top to its bottom remains the same. This usually holds for deep fluidic envelopes due to internal convective motions caused by the presence of internal heat source from the central region of the planet. These "isentropic" pure-Hydrogen mass-radius curves counting from bottom upward in the mass-radius diagram are for specific entropy S (eV/1000K/atom)=0.3,0.4,0.5,0.6,0.7,0.8,0.9,and 1.0 correspondingly. One could see that both Saturn and Jupiter lie relatively close to the S (eV/1000K/atom)=0.3 curve, which is considered to be a (relatively) cold isentropic profile. The nominal surface of truncation of calculation for these mass-radius curves is taken to be at the density of 0.01 g/cc.
Hydrogen EOS data are taken from Becker et al. ApJS 215,21 (2014) https://arxiv.org/abs/1411.4010.
Please also c.f. G. Chabrier, S. Mazevet, F. Soubiran. ApJ 872,247 (2019) https://doi.org/10.3847/1538-4357/aaf99f.
Hydrogen EOS data are taken from Becker et al. ApJS 215,21 (2014) https://arxiv.org/abs/1411.4010.
Please also c.f. G. Chabrier, S. Mazevet, F. Soubiran. ApJ 872,247 (2019) https://doi.org/10.3847/1538-4357/aaf99f.
Full code can be found in the attached notebook.
Related Articles
Related Articles
◼
Li Zeng, Stein B. Jacobsen (2024), Cosmic hydrogen and ice loss lines, Icarus, Volume 414, 116033. https://doi.org/10.1016/j.icarus.2024.116033
◼
Li Zeng, Stein B. Jacobsen, Dimitar D. Sasselov, Michail I. Petaev (2022), EOS Manual, arXiv:2211.06518. https://doi.org/10.48550/arXiv.2211.06518
◼
Li Zeng, Stein B. Jacobsen, et al. (2021), New Perspectives on the Exoplanet Radius Gap from a Mathematica Tool and Visualized Water Equation of State, The Astrophysical Journal, Volume 923, 247. https://doi.org/10.3847/1538-4357/ac3137
◼
Li Zeng, Stein B. Jacobsen, et al. (2019), Growth model interpretation of planet size distribution, PNAS, Volume 116, No.20. https://doi.org/10.1073/pnas.1812905116
◼
Li Zeng, Stein B. Jacobsen, et al. (2018), Survival function analysis of planet size distribution with Gaia Data Release 2 updates. Monthly Notices of the Royal Astronomical Society, Volume 479, Issue 4, October 2018, Pages 5567–5576. https://doi.org/10.1093/mnras/sty1749
◼
Li Zeng, Stein B. Jacobsen, et al. (2017), Exoplanet Radius Gap Dependence on Host Star Type. Research Notes of AAS, Volume 1, 32. https://doi.org/10.3847/2515-5172/aa9ed9
◼
Li Zeng, Stein B. Jacobsen, et al. (2017), Planet Size Distribution from the Kepler Mission and Its Implications for Planet Formation, 48th Lunar and Planetary Science Conference, held 20-24 March 2017, at The Woodlands, Texas. LPI Contribution No. 1964, id.1576. https://www.hou.usra.edu/meetings/lpsc2017/pdf/1576.pdf
◼
Andreas Becker, Winfried Lorenzen et al. (2014), Ab initio Equations of State for Hydrogen (H-REOS.3) and Helium (He-REOS.3) and their implications for the Interior of Brown Dwarfs, The Astrophysical Journal Supplement Series, Volume 215, 21. https://doi.org/10.1088/0067-0049/215/2/21
◼
G. Chabrier, S. Mazevet, F. Soubiran (2019), A New Equation of State for Dense Hydrogen–Helium Mixtures, The Astrophysical Journal, Volume 872, 247. https://doi.org/10.3847/1538-4357/aaf99f
◼
S. Mazevet, A. Licari, F. Soubiran (2020), Benchmarking the ab initio hydrogen equations of state for the interior structure of Jupiter, Astronomy and Astrophysics, Volume 664, A112. https://doi.org/10.1051/0004-6361/201935764
◼
H. S. Zapolsky, E. E. Salpeter (1969), The Mass-Radius Relation for Cold Spheres of Low Mass, The Astrophysical Journal, Volume 158, 809. https://doi.org/10.1086/150240
◼
A. Levi, R. Cohen (2019), The Equation of State of MH-III: a possible deep CH4 reservoir in Titan, Super-Titan exoplanets and moons, The Astrophysical Journal, Volume 882, 71. https://doi.org/10.3847/1538-4357/ab2f76
◼
A. Levi, D. D. Sasselov (2018), A New Desalination Pump Help Define the pH of Ocean Worlds, The Astrophysical Journal, Volume 857, 65. https://doi.org/10.3847/1538-4357/aab715
◼
M. Podolak, A. Levi, A. Vazan, U. Malamud (2023), An Equation of State of CO for use in Planetary Modeling, Icarus, Volume 394, 115424. https://doi.org/10.1016/j.icarus.2023.115424
◼
R. Helled, D. J. Stevenson (2023),The fuzzy cores of Jupiter and Saturn, AGU Advances. https://doi.org/10.48550/arXiv.2403.11657
◼
D. J. Stevenson, Ge131: Planetary Structure and Evolution. https://web.gps.caltech.edu/classes/ge131/
◼
A. Aguichine, O. Mousis, M. Deleuil, E. Marcq (2021), Mass–Radius Relationships for Irradiated Ocean Planets, The Astrophysical Journal, Volume 914, 84. https://doi.org/10.3847/1538-4357/abfa99
◼
W. Misener, H. E. Schlichting, E.D. Young (2023), Atmospheres as windows into sub-Neptune interiors: coupled chemistry and structure of hydrogen-silane-water envelopes, Monthly Notices of the Royal Astronomical Society, Volume 524, Issue 1, September 2023, Pages 981–992. https://doi.org/10.1093/mnras/stad1910
◼
A. Izidoro, H. E. Schlichting, A. Isella, et al. (2022), The Exoplanet Radius Valley from Gas-driven Planet Migration and Breaking of Resonant Chains, The Astrophysical Journal Letter, Volume 939, L19. https://doi.org/10.3847/2041-8213/ac990d
◼
John Southworth (2011), Homogeneous studies of transiting extrasolar planets – IV. Thirty systems with space-based light curves, Monthly Notices of the Royal Astronomical Society, Volume 417, Issue 3. https://doi.org/10.1111/j.1365-2966.2011.19399.x
◼
L. Naponiello, L. Mancini, A. Sozzetti, et al. (2023), A super-massive Neptune-sized planet. Nature 622, 255–260. https://doi.org/10.1038/s41586-023-06499-2
◼
Michelle Kunimoto, Andrew Vanderburg et al. (2023), TOI-4010: A System of Three Large Short-Period Planets With a Massive Long-Period Companion, The Astronomical Journal, Volume 166, 7. https://doi.org/10.3847/1538-3881/acd537
◼
Collin Cherubim, Ryan Cloutier et al. (2023), TOI-1695 b: A Water World Orbiting an Early M Dwarf in the Planet Radius Valley, The Astronomical Journal, Volume 165, 4. https://doi.org/10.3847/1538-3881/acbdfd
◼
Jennifer Burt, Matthew J. Hooton et al. (2024), TOI-1685 b is a Hot Rocky Super-Earth: Updates to the Stellar and Planet Parameters of a Popular JWST Cycle 2 Target, The Astrophysical Journal Letter. https://doi.org/10.48550/arXiv.2405.14895
◼
Charles Cadieux, Mykhaylo Plotnykov et al. (2024), New Mass and Radius Constraints on the LHS 1140 Planets -- LHS 1140 b is Either a Temperate Mini-Neptune or a Water World, The Astronomical Journal Letters, Volume 960, L3. https://doi.org/10.3847/2041-8213/ad1691
◼
.........and many references in the above mentioned articles..........
CITE THIS NOTEBOOK
CITE THIS NOTEBOOK
Cosmic Hydrogen and ice loss lines
by Li Zeng and Stein B. Jacobsen
Wolfram Community, STAFF PICKS, June 18, 2024
https://community.wolfram.com/groups/-/m/t/3196285
by Li Zeng and Stein B. Jacobsen
Wolfram Community, STAFF PICKS, June 18, 2024
https://community.wolfram.com/groups/-/m/t/3196285