The distribution of wealth in a key factor in determining the stability and progress of an economy. This project utilizes agent based models, which are computational systems where autonomous agents follow a certain set of provided rules, interacting with one another and evolving a system. This project takes agents with wealth distributed in a way so as to model real life wealth distribution, and has them trade with each other and then link with other agents, trade, and then repeat. This cycle allows the inequality of the system to be obtained over time. Through experimenting with different parameters, interesting results that provide useful conclusions and insights can be obtained.
Introduction
Introduction
As of Federal Reserve Data of the United States from Q1 of , the top 1% of the population earned 30.45% of all income earned. Q3 of 1989, this was 23.32%. Steadily over time, wealth inequality is increasing, the world getting a stark reminder of the incredibly concentrated wealth as the world got its first trillionaire, and the Top 16 billionaires in the world have seen a cumulative increase in wealth of 1.47 Trillion Dollars. Wealth inequality isn’t simply the poor get poorer and the rich getting richer, but a pressing issue that effects living standards and the stability of countries. The French Revolution, an event that would end up changing the majority of Europe, was caused due to the incredibly unequal wealth distribution, where the nobility held everything and the working class had nothing.
With the interactions of economic agents with one another being hard to predict, how wealth inequality will change going forward is difficult to determine traditionally. Knowing the effect of policies on wealth inequality is similarly hard to pin down using only economic theory. In real life, measuring the wealth of the wealthy is not always accurate, as they may self report deflated or inflated figures. Here, agent based models can work to give me a estimate of how wealth exchange and inequality will work. By setting simple rules that obey observations made in the real world, the model’s agents can form complex relationships, interdependencies and various other interactions, creating a computationally irreducible system that reveal insights about the nature of how wealth exchange works. This is crucial and can help understand how we, as a society, may work towards wealth equality in the future.
1
2024
2
With the interactions of economic agents with one another being hard to predict, how wealth inequality will change going forward is difficult to determine traditionally. Knowing the effect of policies on wealth inequality is similarly hard to pin down using only economic theory. In real life, measuring the wealth of the wealthy is not always accurate, as they may self report deflated or inflated figures. Here, agent based models can work to give me a estimate of how wealth exchange and inequality will work. By setting simple rules that obey observations made in the real world, the model’s agents can form complex relationships, interdependencies and various other interactions, creating a computationally irreducible system that reveal insights about the nature of how wealth exchange works. This is crucial and can help understand how we, as a society, may work towards wealth equality in the future.
Creating a Network
Creating a Network
To create an agent based model, I first require a network of interconnected agents based on a simplified version of the economy. A commonly heard statistic of wealth distribution is “20% of world holds 80% of the wealth” or some rendition of the same. This is based on the Pareto Principle, which is mathematically associated with the power law. As research has proven, the power law does in fact model wealth distribution, hence I use it to distribute the agents to model real life accurately.
For creating the agents, I create a function that takes an input of the number of agents required and a shape value that gives the curve a Power Law distribution.
3
For creating the agents, I create a function that takes an input of the number of agents required and a shape value that gives the curve a Power Law distribution.
The uses and the shape value to create agents, taking the list of numbers generated and turning it into an association for increased efficiency.
wealthCreate[]
RandomReal[]
y
In[]:=
wealthCreate[agents_,y_]:=AssociationThread[Range[agents]->Reverse@Sort@Table[RandomReal[{0,1}]^(-y),agents]]
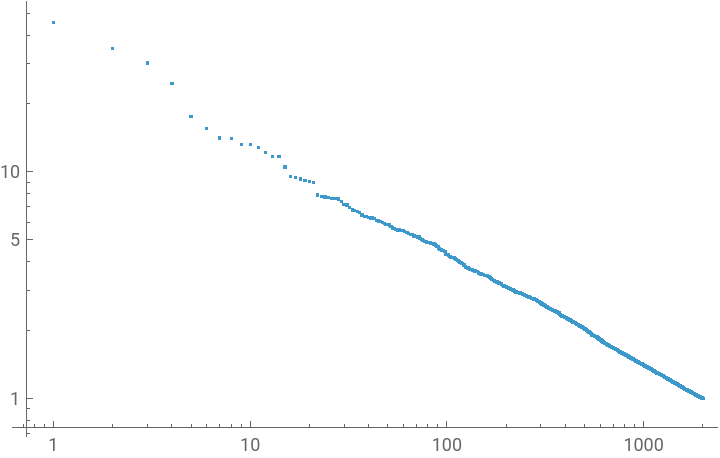
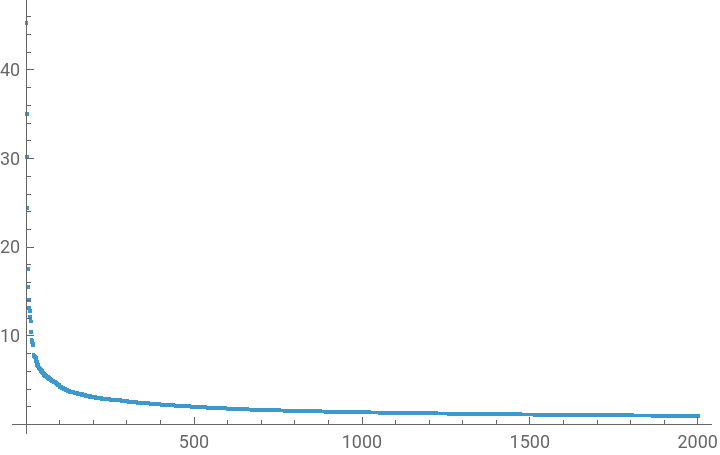
Now, I can create the agents. Lets generate 2000 agents with a shape value of 0.5. I this shape value as I found it gave me wealth distribution most similar to real life. Shape values of 1 and above often cause there to be a single agent that possesses a double digit percentage of the total wealth, which is not accurate to real life.
After generation, I visualized the values using a log-log plot and a linear scale plot, both of which help show the exponential nature of this distribution.
After generation, I visualized the values using a log-log plot and a linear scale plot, both of which help show the exponential nature of this distribution.
In[]:=
agentList=wealthCreate[2000,0.5];
In[]:=
ListLogLogPlot[agentList]ListPlot[agentList,PlotRange->Full]
Out[]=
Out[]=
Now that I have my agents, I need to connect them to each other. In real life, wealth and connections are highly correlated, and typically wealthy individuals are connected with other wealthy individuals. To model this, I require a function that bases the probability of any two agents connecting on their wealth. For this, I reference Kohlrausch, Gustavo L. and Goncalves, Sebastian, Wealth Distribution on a Dynamic Complex Network. This paper utilizes the following formula to determine the probability of two agents forming a connection:
4
i,j
P
connection
ω
i
ω
j
∑
l
ω
l
This formula works by adding the sum of the wealth, ω of any two agents at the current timestep, t, and dividing by the total wealth in the system. The agents that are more wealthy are now more likely to be connected with other agents. I code this as:
The function takes the wealth of two agents and divides by the total wealth, giving probability of connection.
In[]:=
pConnect[{agent1_,agent2_},wealth_]:=(wealth[agent1]+wealth[agent2])/Total[Values@wealth]
Now that I have the probability of two agents linking, I need to generate links between agents.
The function uses the function, mapping it to the all possible links between in agents and obtains a list of all of the edges.
pConnect[]
In[]:=
connecter[wealth_]:=Module[{agents},agents=Length[wealth];Cases[{UndirectedEdge@@#,RandomVariate[BernoulliDistribution[pConnect[{#[[1]],#[[2]]},wealth]]]}&/@Subsets[Range[agents],{2}],{x_,1}:>x]]
connections=connecter[agentList]
In[]:=
connections
153,190,194,1148,1152,1162,1192,1197,1237,1289,1292,1348,1380,1545,1751,1962,1963,11076,11096,11193,11386,11413,11444,11504,
The agents are connected, however seeing thousands of edges is not a good way to view the connections. To visualize this connection, I graphed it.
In[]:=
graph=Graph[Range[Length[agentList]],connections]
Out[]=
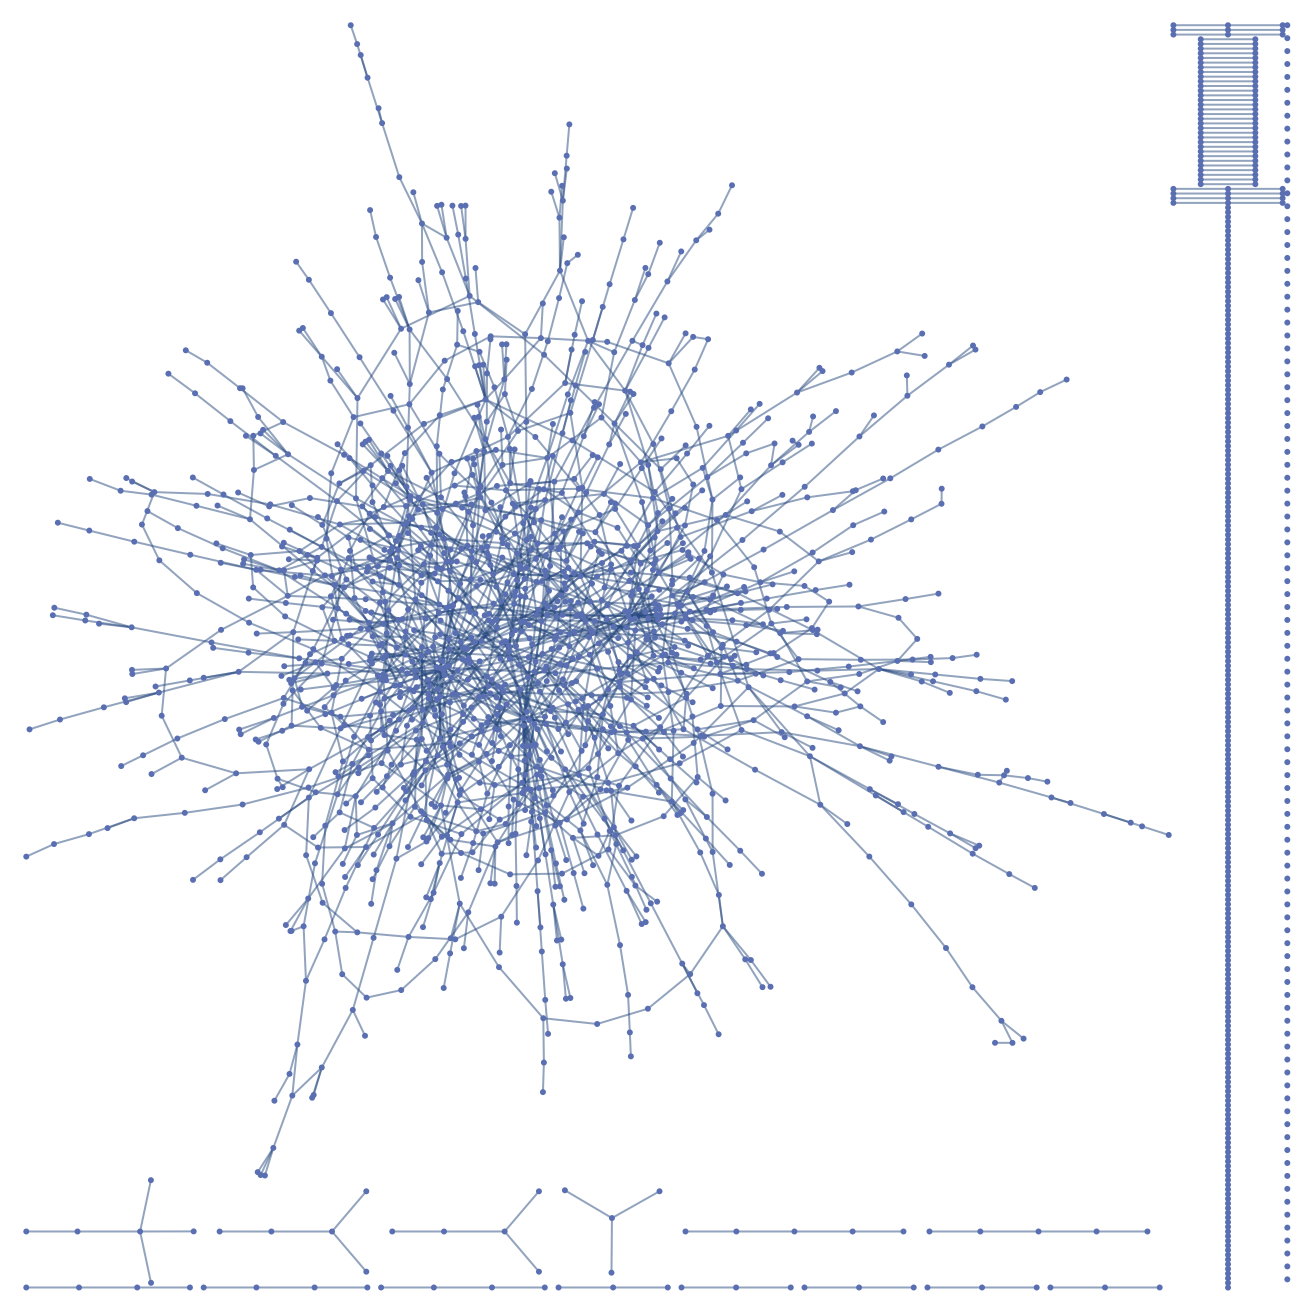
Figure 1: Graph of all agent connections
The graph right now with 2000 agents looks incredibly crowded so it is difficult to tell agents apart. To improve this, I rescaled the vertexes by the number of connections they have and changed the color of the nodes based on their wealth, which will make it easier to understand.
The following code gives the amount of connections for each vertex on the graph, then accordingly rescales their sizes. It then uses wealth to alter color. It then combines the two in a graph.
vd=VertexDegree[graph];vdScaled=Rescale[vd,{Min[vd],Max[vd]},{5,10}];vdSizes=Thread[VertexList[graph]->vdScaled];HighlightGraph[graph,Table[Style[VertexList[graph]〚i〛,ColorData[{"SunsetColors","Reverse"}][(agentList[i]/Max@Values@agentList)^0.29]],{i,VertexCount[graph]}],VertexSize->vdSizes]
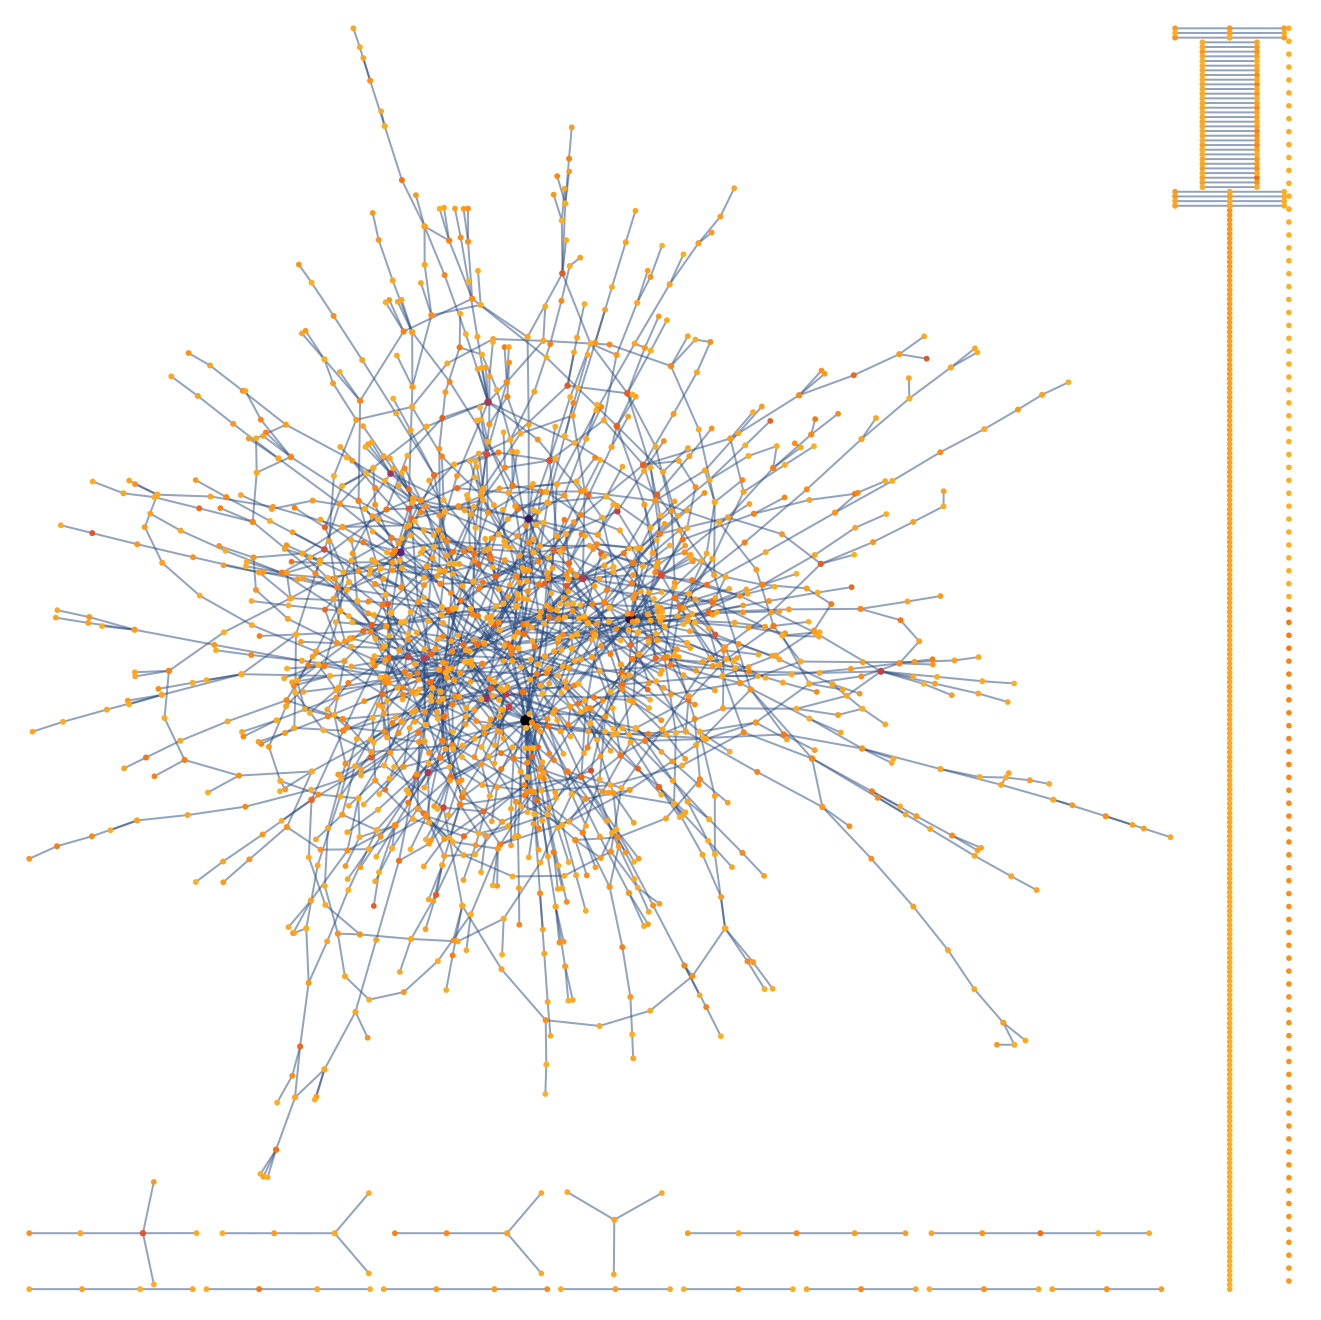
Figure 2: Colored and size scaled graph of agent connections
Above, there are very few extremely rich individuals who are black, a couple wealthy ones that are red and exponentially more who have very little wealth relative to the wealthiest, colored in orange.
Evolving the Network
Evolving the Network
Modeling Ancillary Functions
Modeling Ancillary Functions
Trading Functions
Trading Functions
Trading is simply the exchange of wealth, with the major components being the agents between which the trading is occurring and the amount being transacted. To address these components and evolve the system, I utilize the method described in the paper . This method uses the following mathematical formulas:
The formula below determines the change in wealth, dω that will occur for an agent from the transaction, taking the values of wealth for both agents and then multiplying some trading factor α to each:
The final formula below changes the values of the wealth of the winner and looser, changing them so as to ensure conservation of wealth.
Turning the first formula into a function, I change the trading factor α . The research paper models it as a random number between 0 and 1, however as research has proven, human expenditure follows a log-normal distribution.The log-normal curve is skewed positively and has a long tail towards the right.
After this, I just create a simple function that finds the amount to be exchanged, dω.
Takes the minimum of the amount either side is willing to trade to ensure an agent’s wealth doesn’t go negative.
The function uses the probability of 0.5 to randomly allot each agent pair a value 1 or -1, depending on if the first agent wins the transaction. It then applies the appropriate changes.
Testing the function:
As visible above, the ten values shown have all been altered. Some are up and others are down, all by random chance.
Re-Connection Functions
Re-Connection Functions
Testing the function:
In the above fraction of data, it is visible that some edges such as 1237 have been removed entirely.
Measuring Wealth Inequality
Measuring Wealth Inequality
The function takes the mean of the difference between every possible pair of individuals, divided by the mean size to give Gini Index that goes from 0 to 1
Modeling the Main Function
Modeling the Main Function
Now that all of my ancillary functions have been finished, I can combine them to create one large function that executes all stages of my network evolution cycle. This function will also take the generated data that is useful to me and put it in a list that is accessible once execution has finished. Certain elements, like runNumber and giniAvg, were added by me specifically to make it easier to obtain data.
Results and Analysis
Results and Analysis
These set the values of variables that will be edited through the function and modified to give data that can be displayed and analyzed at the end.
Next, I ran the function for 200 timesteps, 120 times.
Now that I have the data, I need to display it. Displaying the mean of all of the Gini index values through time and values of uncertainty for certain timestamps will be useful. For this I model two functions:
The function below gathers all Gini Index values at a given point across experiments.
The function below generates error bar coordinates through the previous function at steps of 10.
Creates a plot for error bars and Gini Average together .
Figure 3: List Plot of Average Gini Index against timesteps
Figure 3 : List Plot of a random cycle’s Gini Index against timesteps
As shown above in this following graph of the average and an individual runs, the Gini Index levels out to one value at a certain timesteps and from thereon out, stays stable. Observing this, it is clear that at a point in the economy, the exchanges between the economic agents no longer affect the inequality in the system.
Figure 5: List Plot of wealth values for the last timestep
As visible above, the changes at this state become incredibly small.
Here is the graph of the end state from another run.
Figure 6: Graph of wealth values for the last timestep
As demonstrated above, the red or the wealthiest are, at some point, completely connected to the blue . This means that in trades between a red and a blue, amounts exchanged are incredibly minute . Alternatively if two reds connect, their exchange conserves wealth in upper strata, leading to no net change in inequality.
I observe that in a network, change in inequality doesn’t stop when the Gini Index reaches 1, but instead change in inequality stops when the poor and rich get separated into two classes apart from one another. Here, I observe a key problem with wealth inequality as well: As I attempt the reduce the wealth gap, I might elevate the wealthiest of the poor and bring down the poorest of the wealthy, however now interactions can start evolving the Gini Index again, since there are no longer two separate strata of wealth. Despite having their wealth decreased, the upper middle class can still gain an upper hand in interactions with those less wealthy, and over time the model will likely rebound to the original, highly unequal state.
Conclusion
Conclusion
In conclusion, through this project I have created a system by which to create and evolve an agent based model that serves as a simplified economy to track wealth exchange between agents and find the wealth inequality throughout the evolution of the system using the Gini Index. I then took the results, analyzed them to figure out the reason for the obtained values and created a theory on what would happen on adjusting the model based on observed behaviors. This model has great potential to be used to find ways to reduce wealth inequality in real life, potentially aiding the millions of people living in highly unequal countries, and could be a useful economic tool for governments to view the impact of certain policies on the wealth inequality in a country and take decisions accordingly.
Future Directions
Future Directions
The model I developed here has a lot of potential as there are multiple possible things I can implement in the future. The first is Pareto Improvement. Pareto Improvement refers to when reallocation of resources leads to an increase in at least one agent’s utility while not decreasing the utility of any other agent. By creating a system by which I can measure the utility of a transaction for both agents involved, I can calculate whether the condition for Pareto Improvement. This can be used to track the system’s progress and resource allocation, checking if and when the economy is making positive progress.
The second idea is to decrease the inequality in systems. By taking the highly unequal end states of my models, I can use various parameters such as taxes to attempt to bring the inequality down. By doing this, I can assess the most effective methods for making a system more equal, which can be useful to figure out how to improve countries that are highly unequal.
Being an agent based model attempting to model the real world, there is endless complexity that can be added to this model, helping model the world with more detail derive specific insights that can help the world become more equal.
References
References
1. Board of Governors of the Federal Reserve System. (2024). Distributional Financial Accounts: Shares of income and wealth by percentile groups, Q1 2024 [Data set]. Federal Reserve. https://www.federalreserve.gov/releases/efa/efa-distributional-financial-accounts.htm
2. Americans for Tax Fairness. (2026, June 16). Billionaire wealth surges past $9 trillion for first time. https://americansfortaxfairness.org/billionaire-wealth-surges-past-9-trillion-for-first-time/
3. Levy, M., & Solomon, S. (1997). New evidence for the power-law distribution of wealth. Physica A: Statistical Mechanics and Its Applications, 242(1–2), 90–94. https://doi.org/10.1016/S0378-4371(97)00217-3
4. Kohlrausch, G. L., & Gonçalves, S. (2024). Wealth distribution on a dynamic complex network. Physica A: Statistical Mechanics and Its Applications, 652, Article 130067. https://doi.org/10.1016/j.physa.2024.130067
Acknowledgements
Acknowledgements
I would like to first thank my mentor, Sebastian Rodriguez. He has guided me throughout my journey making this project, and has helped me with resources, research, code and writing every step of the way. Without him, my project would not have reached the stage it has right now. I would also like to thank Eileen Lee and Kaavya Majumder, the TAs that read through my draft and gave me incredibly useful advice that really helped me hone and polish my Computational Essay. Thank you to all of the staff at the Wolfram Highschool Summer Research Program, especially the directors for giving me the opportunity to explore wolfram language, new concepts and create a wonderful project as well for providing the learning environment to be able to do so. Thank you to Stephen Wolfram for creating the Wolfram Summer Research Program that has allowed me to create this wonderful project and for innovating in cellular automata, the research of which lead me to discovering Agent Based Models. Thank you Minghao Guo so much for reading my essay. Without his help, I would not have been able to finish my project.
CITE THIS NOTEBOOK
CITE THIS NOTEBOOK
Developing complex networks by modeling wealth exchange through agent based models
by Ojasvi Singla
Wolfram Community, STAFF PICKS, July 9, 2026
https://community.wolfram.com/groups/-/m/t/3751127
by Ojasvi Singla
Wolfram Community, STAFF PICKS, July 9, 2026
https://community.wolfram.com/groups/-/m/t/3751127