Maximizing the impact of financial aid for developing countries through efficient allocation of funding is a significant objective in various fields of Economics. However, the lack of a general solution to this issue persists, primarily due to insufficient data available for comprehensive analysis. To address this challenge, we propose the utilization of statistical and artificial generative inference methods to overcome data limitations. This paper specifically focuses on employing classification algorithms to classify project descriptions for loans granted by the International Bank for Reconstruction and Development (IBRD) to developing countries as either successful or unsuccessful allocations of financial aid. By leveraging the power of machine learning techniques, we aim to provide a valuable framework for evaluating the effectiveness of financial aid projects.
Introduction
Introduction
The International Bank for Reconstruction and Development (IBRD) is one of the five institutions that make up the World Bank Group, with a primary purpose to provide loans and other financial products to middle-income and creditworthy low-income countries for development projects. The IBRD uses funds to provide loans and financial assistance to member countries. The loans provided by the IBRD are typically used for social and economic development initiatives.
Information on over 20,000 issued loans is publicly available online and provides valuable data on underlying connections between countries, sectors, loan amounts, repayment terms, and development outcomes. Analyzing this data can offer insights into the field of Development Economics, exploring the relationship between financial assistance and long-term sustainable development. This data-driven approach helps inform evidence-based policies, facilitating informed decision-making for achieving sustainable development goals.
Information on over 20,000 issued loans is publicly available online and provides valuable data on underlying connections between countries, sectors, loan amounts, repayment terms, and development outcomes. Analyzing this data can offer insights into the field of Development Economics, exploring the relationship between financial assistance and long-term sustainable development. This data-driven approach helps inform evidence-based policies, facilitating informed decision-making for achieving sustainable development goals.
Data Processing
Data Processing
We start by processing our initial data from the IBRD. However, as this project has a focus on natural language understanding, it is clear that supplemental data will be needed to complement the in depth numerical data provided by the Wolfram Data Repository. Such data includes project descriptions, and more precise textual information on each project, stored to the infoData variable.
Imports and filters data:
In[]:=
originalData=ResourceData["IBRD Statement of Loans"];numericalData=originalData[All,{11,15,16,17,18,20,21,22,23,24,26}];ibrdData=DeleteDuplicatesBy[originalData[All,{3,5,10,13,28,27,31,15}],#[[4]]&];infoData=Dataset[CloudGet["https://www.wolframcloud.com/obj/db573283-3016-490b-ba30-70c87d4240cb"]];
Rather than acting independently, we can use the shared Project ID from both the ibrdData and infoData to filter and merge the numerical data with textual information.
Merges datasets by ID:
In[]:=
commonList=Intersection[infoData[All,1],ibrdData[All,4]];infoDataPos=Flatten[Position[infoData[All,1]//Normal,#]&/@Normal[commonList]];ibrdDataPos=Flatten[Position[ibrdData[All,4]//Normal,#]&/@Normal[commonList]];mergedData=Dataset[Table[Join[Normal[infoData[infoDataPos[[i]],All]],ibrdData[ibrdDataPos[[i]],All]],{i,Length[commonList]}]];
Loan Allocation Quantity Analysis
Loan Allocation Quantity Analysis
The abundance of strictly numerical data allows us to visualize loanable funds through a new lense. This allows us to learn more about patterns in the information by relatively looking at different quantities, rather than just looking at sequences of abstract values.
By using visualizations, we can see how the quantity of loanable funds varies across different regions, sectors, and time periods. We can also compare the distribution and correlation of loanable funds with other variables.
By using visualizations, we can see how the quantity of loanable funds varies across different regions, sectors, and time periods. We can also compare the distribution and correlation of loanable funds with other variables.
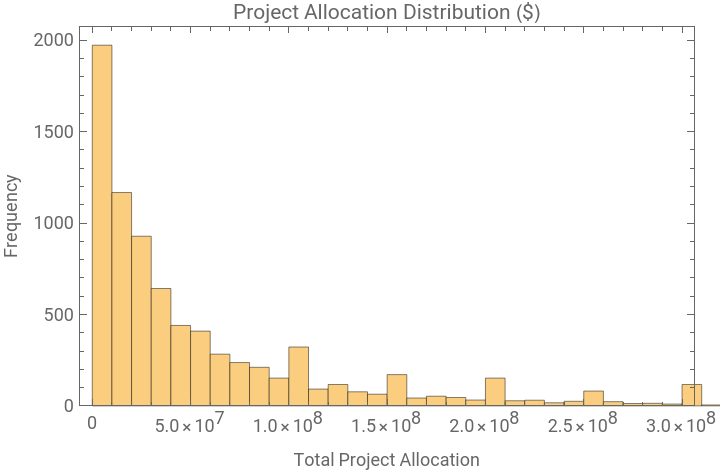
Below is a display of the different amounts loaned to developing nations from the bank.
Plots histogram of allocation quantities:
In[]:=
Histogram[Normal[QuantityMagnitude[numericalData[All,2]]],Axes->True,PlotLabel->"Project Allocation Distribution ($)",Frame->True,FrameLabel->{"Total Project Allocation","Frequency"}]
Out[]=
To examine correlations that may be significant in determining loan allocation, we can look at a variety of attributes in our data. One standout section of interest is the length of the project description. In theory, a more detailed and longer project description should correlate to a well-thought out and researched plan, increasing the potential for a successful investment, and room for more generous function.
Creates dataset between project descriptions and loan allocation:
In[]:=
len2alloc=mergedData[All,{2,-1}];replaceLength[x_]:=Which[True,StringLength[x]]replaceDollars[x_]:=Which[True,QuantityMagnitude[x]]len2alloc=len2alloc[All,{1->replaceLength,2->replaceDollars}];
Plots description lengths vs. total allocation:
In[]:=
lengths=Normal[len2alloc[All,1]];allocations=Normal[len2alloc[All,2]];Print["Correlation: ",Correlation[lengths,allocations]]plt=ListPlot[Transpose[{lengths,allocations}],PlotLabel->"Title Length vs. Total Project Allocation",Frame->True,FrameLabel->{"Title Length","Total Project Allocation"}]
Correlation: 0.0938958
Out[]=
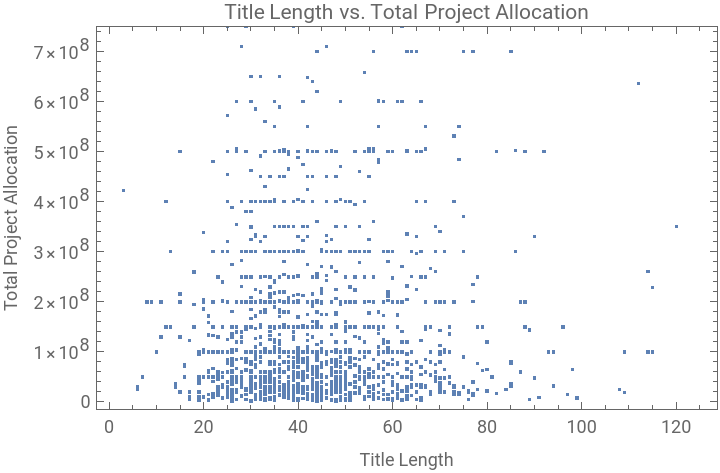
A correlation of 0.0939 suggests a weak, positive, linear correlation between the lengths of project descriptions and total project allocation. While it is obvious that there is no clear interdependency between description length and allocation, the plot shows some interesting patterns, such as the frequent clustering of allocation amounts near round numbers.
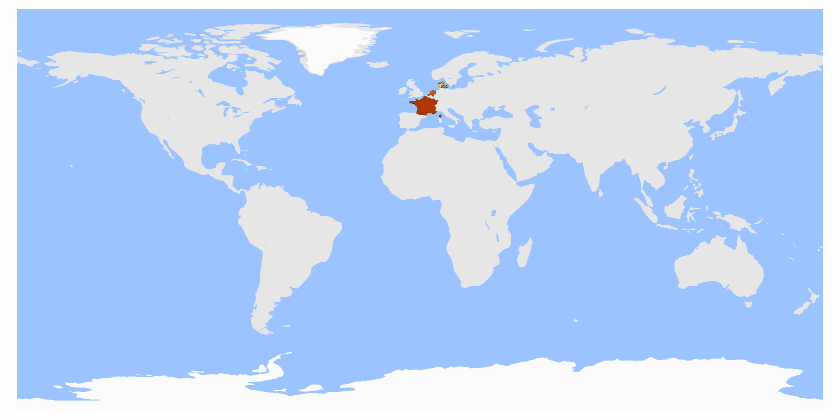
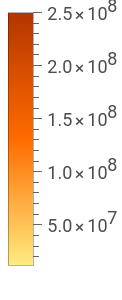
To better visualize how nations are given loans as a function of time rather than other obvious attributes, we can examine the different total principal amounts given to countries by year.
Makes association between years, country and loan amount, with structure suitable for use in GeoRegionValuePlot:
In[]:=
yearLoan=originalData[All,{5,15,31}];countrys=Normal[yearLoan[All,1]];amounts=Normal[QuantityMagnitude[yearLoan[All,2]]];dates=Table[DateValue[yearLoan[i,3],"Year"],{i,1,Length[yearLoan]}];countryamountdate=MapThread[<|"Country"->#1,"Amount"->#2,"Start"->#3|>&,{countrys,amounts,dates}];groupedStart=GroupBy[countryamountdate,#["Start"]&];groupedStartCountry=Map[#->GroupBy[groupedStart[#],#["Country"]&]&,Keys[groupedStart]];summedData=Table[AssociationThread[Keys[groupedStartCountry[[n]]],Total[Values[#]][[2]]&/@Values@groupedStartCountry[[n]]],{n,Length[groupedStartCountry]}];summedData=MapKeyDrop#,&,summedData,{2};summedData[[1;;2]]
Out[]=
19472.5×,1.91044×,4.×,1.2×,19481.59558×
8
10
8
10
7
10
7
10
7
10
Makes animation to view total project allocation for every country, by year:
In[]:=
Manipulate[GeoRegionValuePlot[(Values[summedData[[i-1946]]][[1]]),GeoRange->"World"],{i,1947,2016,1},SaveDefinitions->True]
Out[]=


Project Topic Analysis
Project Topic Analysis
Each project has important, unique attributes that make the project valuable to the community. However, some concepts are consistently similar over all of the loans. While it is hard to grasp what exactly make words similar, and even harder to numerically encode these relationships, we can use a variety of methods to simulate the process of determining the active words that are shared between many projects, essentially capturing the main concept being addressed.
One way of examining how common topics are in each project is through a simple Word Cloud. This allows us to visualize the words in a multi-dimensional viewpoint, including the relative frequency of each item compared to other words.
Gathers list of all relevant words in project titles and project descriptions
In[]:=
allTitles=Select[DeleteStopwords[Flatten[ToLowerCase[#]&/@StringSplit[#,Except[(LetterCharacter|"'"|"-")]..]&/@Normal[mergedData[All,2]]]],StringLength[#]>=4&];allDesc=Select[DeleteStopwords[Flatten[ToLowerCase[#]&/@StringSplit[#,Except[(LetterCharacter|"'"|"-")]..]&/@Normal[mergedData[All,3]]]],StringLength[#]>=4&];
Plots Word Clouds of titles and descriptions, and drops filler words:
In[]:=
Row[{WordCloud[(Reverse@Sort@Counts@allTitles)[[3;;-1]]],WordCloud[(Reverse@Sort@Counts@allDesc)[[4;;-1]]]}]
Out[]=
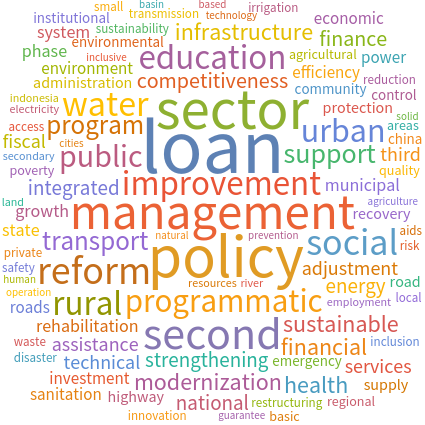
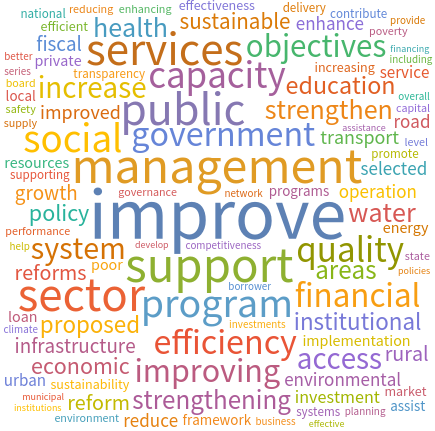
As expected, we have many descriptive words that appear to be the most important in the Word Cloud. However, some words, such as “water”, “education”, and “health”, are words that have a sense of value in the attempt to find the main topic of each project.
This Word Cloud experiment gives merit to working the most used words in order to classify projects. Below, we determine which word in a project title is used most often throughout all descriptions. Filtering out all words except the most popular word in each project title allows us to broadly classify the main topic of a project.
Gathers list of most used words in descriptions, excluding arbitrary terms:
Reduces each title to only the most popular word in the list:
Graphs 10 most used words and corresponding number of titles which were reduced to contain only the word:
Classification of Project Descriptions to Status with Original Data
Classification of Project Descriptions to Status with Original Data
One of the hardest things to do in the integration of computational analysis with natural sciences like economics is the quantification of success. In our case of efficient allocation of financial aid, it is very challenging to develop a value that represents how a country has benefitted due to a loan, due to the total number of factors involved. A loan focused on education could be tailored for a variety of tasks, such as improving school infrastructure, literacy rates, graduation rates, proportion of students that pursue further education, or countless other categories. To generalize the change in such a vast spectrum of areas in a single number is near impossible.
Rather than attempting to find new data to quantify the change, we can use information already present in our dataset. One attribute we have that relates to outcomes of data is the loan status. Assuming that all money relating to the loan is generated through either profits of investments from the loan or from the loan itself, a fully repaid loan of size n would imply that the presence of financial aid generated an extra n dollars in the loan category industry for a specific country.
Therefore, a fully repaid loan represents successfully allocated funding, and a cancelled or terminated loan represents an inefficient allocation.
The Classify function allows for the classification of items into a set amount of groups. With our new definitions of success and failure, we can utilize this function to create a prediction algorithm to classify if a project description led to a successful or failed outcome.
Creates dataset of descriptions and loan status:
Formats loan status values to numbers:
Uses BERT word vector generator to convert sentences to numerical lists:
Remakes dataset architecture:
Filters and deletes rows for final preprocessing:
Implements classifier model on training data:
Tests model on test data:
The accuracy achieved in our predict function suggests that the model performs worse than if it was simply guessing. This means that even with the numerical representation of each sentence, the model failed to understand the implicit meanings and classify the loan status based on the underlying connections between words. It is not a surprise, however, that this occurred. With only 80 samples, there is a miniscule chance that the model is able to understand such a complex knowledge base.
Data Augmentation Strategy
Data Augmentation Strategy
A method to combat this lack of data is augmentation, which utilizes changing features of data that are not entirely relevant to the final outcome. For instance, when using images, it is commonplace to introduce flipping of the pictures in data to increase training size. An image of a cat is still an image of the cat, whether it is facing left or right. Therefore, flipping the direction of the image does not introduce any level of inaccuracy in our training data, and increases our training size by at least double.
In a word based structure, one trivial variable we can change is the string that corresponds to a certain definition. In essence, this means replacing words with their synonyms. When replacing a word with its corresponding synonym, we can be confident that a majority of the time, the overall meaning of the sentence will not be drastically changed, but the amount of sentences increases. We will utilize this method of augmentation into our own data to significantly increase our training data in an effort to improve the accuracy of our classification model.
In a word based structure, one trivial variable we can change is the string that corresponds to a certain definition. In essence, this means replacing words with their synonyms. When replacing a word with its corresponding synonym, we can be confident that a majority of the time, the overall meaning of the sentence will not be drastically changed, but the amount of sentences increases. We will utilize this method of augmentation into our own data to significantly increase our training data in an effort to improve the accuracy of our classification model.
Defines function to return a list of sentences, each with 1 word from original sentence replaced with synonym:
Displays augmentation process on example sentence:
Applies augmentation to sentence data:
Matches status values to augmented data:
Classification on Augmented Data
Classification on Augmented Data
Using the new augmented data, we will retrain our model. The same process is used from the original classify function, but we have significantly increased the amount of data we have.
Uses BERT to quantify synthesized sentences:
Develops and filters data:
Randomizes lists while maintaining relative order:
Splits training and testing data:
Trains classifier on training data:
Displays testing scores:
While our model still underperform in relation to expectations, the presence of augmented data increases our accuracy by nearly 30%. The development of models for evaluating efficiency of the allocation of financial aid is clearly a field for definite improvement.
Conclusions and Future Work
Conclusions and Future Work
By training classification algorithms on a dataset of project descriptions and their corresponding outcomes, we have explored patterns and factors that contribute to the success or failure of financial aid projects . Our findings indicate that machine learning techniques can be valuable tools for evaluating the effectiveness of financial aid allocations . By accurately classifying projects as successful or unsuccessful, these algorithms can assist in the efficient allocation of financial resources, leading to improved outcomes and greater impact in developing countries .
In the future, we plan to develop a method to evaluate the efficiency of loan projects from the IBRD in terms of their impact on the innovation performance of the recipient countries. We plan to use supplemental data sources as a way to quantify the improvement of sectors in a nation, and use a high-level machine learning model to assess whether proposed projects are efficient allocations based on training on previous examples.
CITE THIS NOTEBOOK
CITE THIS NOTEBOOK
Maximizing societal impact through efficient allocation of funding in developing countries
by Mihir Garimella
Wolfram Community, STAFF PICKS, July 13, 2023
https://community.wolfram.com/groups/-/m/t/2965044
by Mihir Garimella
Wolfram Community, STAFF PICKS, July 13, 2023
https://community.wolfram.com/groups/-/m/t/2965044