Learning a new language is a valuable skill that can introduce us to a new worldview, help us in propelling our career in the globalised economy, and allow us to connect more deeply with a foreign language speaker. Owing to this, second language acquisition has become an active area of research. Native Language Identification (NLI) is a raging subfield of SLA; it entails predicting a writer’s native language based on text/speech inputted by them. According to computational linguists, NLI can help English as Second Language (ESL) instructors to personalise English teaching material based on the student’s native language. This project makes an attempt at studying the linguistic features of English essays written by ESL learners and unveiling native-language-specific patterns in the essays.
Introduction to the task
Introduction to the task
What’s the task at hand?
The task at hand is to predict a writer's native language based on an essay/passage inputted by them. In the realm of linguistics, this task is called Native Language Identification (NLI). It is based on the assumption that an author's native language (L1) somehow influences the way they produce text and speech in a second language (L2), and therefore, by spotting native-language-specific patterns patterns in the L2 text, one can trace back to the author's native language.
Sounds great!....but why do we want to find out the person’s native language?
According to Zampieri et al. (2013), NLI methods can be applied to learner corpora to investigate the influence of native language in second language acquisition and production, which could help ESL instructors to personalise English teaching material based on the student’s native language. Additionally, NLI methods can also be an important part of several Natural Language Processing systems including, for example, author profiling systems developed for forensic linguistics.
I see, what a useful tool, both for education and fighting crime!
I know, right?
Yes..but WAIT! How can a machine distinguish between a Hindi learner’s writing style and say, a Chinese learner’s writing style?
That's a good question. We want our computers to discern the difference in the structures of different languages (after all, that's what it is classifying!). For that purpose, we need to feed our computer with "vital data" about the linguistic structure of the essays that we input. In more concrete terms, this vital data encompasses the following :
1
.Lexical features:
1
.1
.Word n-grams
1
.2
.Character n-grams
1
.3
.Lemma n-grams
1
.4
.Lexical Richness
2
.Morpho-syntactic features:
2
.1
.Parts of Speech (POS) n-grams
3
.Syntactic features:
3
.1
.Sentence Constituents (These are sub-phrases of a sentence belong to a specific category of grammar like NP (noun phrase) and VP(verb phrase)).
4
.Qualitative features (in the context of the essay dataset we will use):
4
.1
.Topic of the essay (The dataset that I am using for this project contains essays written on 2 topics: “Smoking” and “Part-time jobs”.)
Therefore, for every passage/essay that we want to classify, we will feed a vector of its features to the machine to help it figure out the native language of the writer.
Alright, I think I get that. You will be generating a list (which you called a “vector”) of around n items mentioned in the above section (which you called features) to a machine, right?
Exactly, and you know what the greatest part is? What you just described is called “Feature Engineering” in the Machine Learning/AI Realm
Oh nice, I’m something of a machine learning engineer myself. 😎
Collecting Data
Collecting Data
What data do you generally need for Native Language Identification?
Based on the literature available on NLI, TOEFL11 is the benchmark dataset for the problem of NLI.
“TOEFL11”...sounds fancy!
You bet it is. TOEFL11 is a dataset that was provided by the organizers of the NLI Shared Task 2013 for evaluating NLI Systems. It is hosted on Linguistic Data Consortium and consists of 12,100 English learner essays from speakers of 11 different languages which were collected in the process of administering the Test of English as a Foreign Language (TOEFL) between 2006-2007.
However, the dataset was found behind a paywall of USD 1000. Therefore, I had to bid farewell to this dataset. Luckily, I found the ICNALE Written Essays corpus available free of cost on Google.
However, the dataset was found behind a paywall of USD 1000. Therefore, I had to bid farewell to this dataset. Luckily, I found the ICNALE Written Essays corpus available free of cost on Google.
Yay open-source, what is the ICNALE Written Essays corpus all about?
According to ICNALE’s website, “The ICNALE (International Corpus Network of Asian Learners of English) is an international learner corpus developed by Dr. Shin Ishikawa, Kobe University, Japan. The ICNALE includes more than 10,000 topic-controlled speeches and essays produced by college students (incl. grad students) in ten countries/regions in Asia (China, Hong Kong, Indonesia, Japan, Korea, Pakistan, the Philippines, Singapore/ Malaysia, Taiwan, and Thailand).”
For this project, I used the “Written Essays” subset of the corpus, which consists of about 5600 essays from the English language learners across the 10 countries. The essays are equally divided into 2 topics: "Smoking" and "Part-time jobs for college students"
For this project, I used the “Written Essays” subset of the corpus, which consists of about 5600 essays from the English language learners across the 10 countries. The essays are equally divided into 2 topics: "Smoking" and "Part-time jobs for college students"
So, a dataset with country names and essays. Weren’t you classifying languages though?
That is true. However, to perform native language identification, I made the assumption that a significant proportion of essay-writers from each country had the country’s most-spoken language as their native language. However, Singapore is a linguistically diverse with comparable proportion of Malay, Tamil and Mandarin speakers. Therefore, I decided to exclude it from the dataset.
Country VS Language
Country VS Language
Country | Language |
China | ChineseMandarin |
HongKong | Cantonese |
Indonesia | Indonesian |
Japan | Japanese |
Korea | Korean |
Pakistan | Urdu |
Philippines | Tagalog |
Singapore | [NOTINCLUDED] |
Taiwan | TaiwanMandarin |
Thailand | Thai |
Importing the dataset
Importing the dataset
2 global variables that represent the list of native languages and the topics of the essays in the ICNALE dataset respectively:
In[]:=
LANGS = {"Cantonese","Indonesian","Japanese","Korean","ChineseMandarin","Tagalog","TaiwanMandarin","Urdu", "Thai"};TOPICS = {"SMK", "PTJ"};
To store my data in the Wolfram Notebook, I created an association called datasetTxt, where each key is a language that maps to yet another association (let’s call it a “sub-association”). Each sub-association has 2 keys: “SMK” and “PTJ”. These keys represent the topics of the essays and map to a list of essays written on the respective topics, in the concerned language.
datasetTxt, the association with languages, topics and respective essays:
In[]:=
datasetTxt = CloudGet["https://www.wolframcloud.com/obj/f53443e8-89bf-43da-9fa0-270d0fc92ed9"];
Analysing the dataset
Analysing the dataset
Helper functions for drawing the bar charts :
In[]:=
createBarChart[data_Association, langs_List, topic_String] := BarChart(Length[data〚#1〛〚topic〛]&)/@langs,PlotTheme"Detailed",ChartLabelsPlacedlangs,Axis,Rotate#1,&, ChartStyle->"Pastel"
π
4
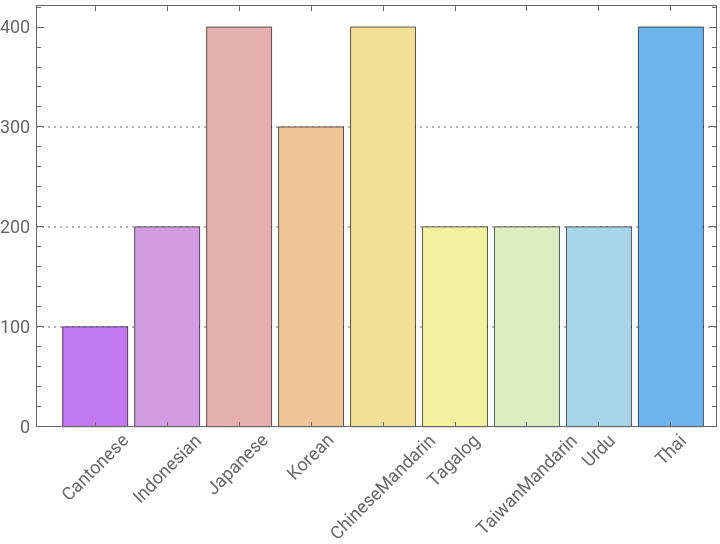
Checking the proportion of essays available for each language:
In[]:=
createBarChart[datasetTxt,LANGS, "SMK"]
Out[]=
In[]:=
createBarChart[datasetTxt,LANGS, "PTJ"]
Out[]=
We can clearly infer from the bar charts that we don' t have the same number of essays for all the languages . In terms of ML, this is called a class imbalance . Cantonese examples are disproportionately lower than the other languages. Therefore, to ensure an equal proportion of essays across all languages, while at the same time not compromising on the number of training examples, I decided to drop the “Cantonese” class and deleted 200, 200, 200, 100 random essays written by Thai, Japanese, Chinese (Mandarin) and Korean ESL Learners respectively for each of the topics.
Defining a new language list after dropping Cantonese:
In[]:=
LANGS2 = {"Indonesian","Japanese","Korean","ChineseMandarin","Tagalog","TaiwanMandarin","Urdu", "Thai"};
Shuffling the essays for each language and topic:
In[]:=
shuffleList[list_] := ResourceFunction["Shuffle"][list,"RandomSample"]shuffledDataset = Association[Table[LANGS2[[n]] -> <|"SMK" -> shuffleList[datasetTxt[[LANGS2[[n]]]][["SMK"]]], "PTJ" -> shuffleList[datasetTxt[[LANGS2[[n]]]][["PTJ"]]]|>, {n, LANGS2 // Length}]];
Creating a new dataset, newDatasetTxt, after dropping the Cantonese Keys and bringing the essay count of a specific topic to 200 (per language)
In[]:=
newDatasetTxt//Keys
Out[]=
{Indonesian,Japanese,Korean,ChineseMandarin,Tagalog,TaiwanMandarin,Urdu,Thai}
Checking the proportion of essays available for each language in the new dataset:
In[]:=
createBarChart[newDatasetTxt,LANGS2, "SMK"]
Out[]=
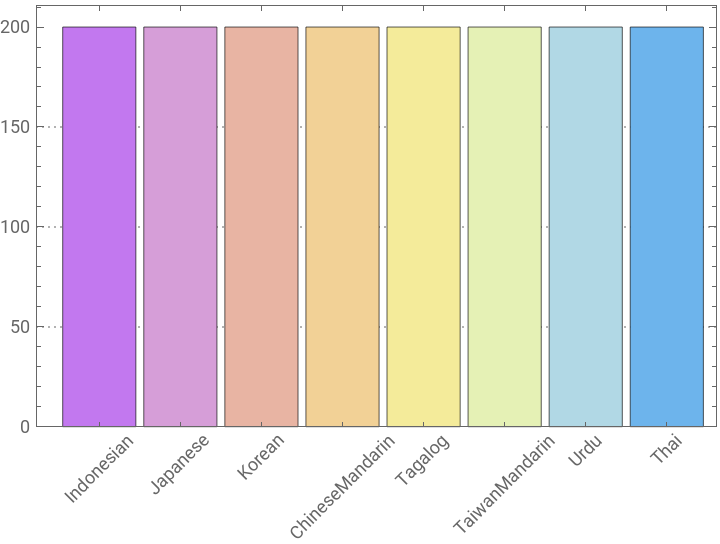
The data's finally balanced (like all good things should be!). What to do next?
Now that we have our data sorted, let us extract the statistics and other linguistic features of our data. More on that in the next section!
Extracting the features of the essays
Extracting the features of the essays
After setting up my dataset, I coded helper functions to extract the following features of the essay:
Document-level features
Document-level features
1
.Word count of the essay
2
.Sentence Count of each passage
Why do we need these "document-level" features?
In many text classification settings, the statistics of the text data, which includes the word count, sentence count, and average sentence length can prove to be of great help in discerning which class the text belongs to. But to ascertain this for my dataset, I will have to visualize the distribution of word counts of the essays across all languages. The ItaliaNLP team (Cimino and Dell' Orletta, 2017) also used this technique for the 2017 NLI shared task implementation, achieving on accuracy of 0.88 on TOEFL11 .
In many text classification settings, the statistics of the text data, which includes the word count, sentence count, and average sentence length can prove to be of great help in discerning which class the text belongs to. But to ascertain this for my dataset, I will have to visualize the distribution of word counts of the essays across all languages. The ItaliaNLP team (Cimino and Dell' Orletta, 2017) also used this technique for the 2017 NLI shared task implementation, achieving on accuracy of 0.88 on TOEFL11 .
Sentence- level features
Sentence- level features
1
.Average sentence length of the essay
Essay-complexity features
Essay-complexity features
1
.Average word length of the essay (Average number of characters in each word)
◼
According to Lewis & Frank (2015), “English language tends to encode conceptually more complex meanings with longer forms". Therefore, studying the average word length of the essay could help us understand the lexical complexity of the essays.
2
.Lexical Richness of the passage using Type-Token Ratio (TTR)
◼
TTR is the ratio obtained by dividing the types (the total number of different words) occurring in a text by its tokens (the total number of words). A high TTR indicates a high degree of lexical variation while a low TTR indicates the opposite. This feature can also help us understand the lexical complexity of the essays.
Why do we need to encode and compare text complexity anyway?
Studies on Cross-Linguistic Influence (CLI) have showed that second language learners find it easier to learn the lexicon and syntax of a second language if their first language converges (shows significant linguistic similarity) to it. Therefore, visualising the average word length and TTR and correlating it with theoretically established linguistic similarities (more on this later) can help us ascertain this relationship.
Studies on Cross-Linguistic Influence (CLI) have showed that second language learners find it easier to learn the lexicon and syntax of a second language if their first language converges (shows significant linguistic similarity) to it. Therefore, visualising the average word length and TTR and correlating it with theoretically established linguistic similarities (more on this later) can help us ascertain this relationship.
Uni-gram frequency features
Uni-gram frequency features
1
.Word uni-gram frequency
◼
Word-uni gram frequency (or simply word frequency) can help us in understanding the most frequently used words in the text. However, since we are analysing the word frequency differences in essays written on the SAME TOPIC, just by different native-language groups, it could help to look at finer frequency patterns (say, patterns beyond the "top 5-used words" as they could be pretty standard based on the essay topic."
2
.POS uni-gram frequency
◼
These are linguistic categories (or word classes) assigned to words that signify their syntactic role. Basic categories include verbs, nouns, adjectives, determiners, etc. These n-grams can help capture small and very local syntactic patterns of language production; therefore, they have been been constantly used as features for creating NLI systems.
We will use all the below functions to create visualisations of the dataset and observe essay patterns based on the writer’s native language.
We finally have our helper functions, thank you Wolfram Language. What to do next?
Now that we have our functions sorted, let us visualise the essay features and make some inferences!
Woohoo!
Visualising the features of the essays
Visualising the features of the essays
Helper functions for creating visualisations
Number of words in the essay
Number of words in the essay
Distribution in the number of sentences in the words for a particular topic.
We can observe only slight differences among the average word counts across the language. This could probably be the case because essay writers were constrained to write within a certain word limit and above a specified word threshold. Therefore, there is not much value in using word count as a feature while identifying the essays using machine learning.
Comparing the number of sentences in the essay
Comparing the number of sentences in the essay
Distribution in the number of sentences in the essay for a particular topic:
We observe greater variance in the average sentence counts in comparison to average word counts. Therefore, there is some value in using sentence count as a feature while identifying the essays using machine learning.
Comparing the average sentence length
Comparing the average sentence length
Distribution of the average sentence lengths for a particular topic.
We observe great variance in the average sentence counts in comparison to average word counts . Therefore, there is some value in using sentence count as a feature while identifying the essays using machine learning .
Average word length (with and without stopwords)
Average word length (with and without stopwords)
Distribution of the average word lengths for a particular topic.
Distribution of the average word lengths for a particular topic after removing Stopwords.
Type-Token Ratio
Type-Token Ratio
Visualising the median Type-Token Ratio for the essays across the languages.
1
.From the given whisker plot, we observe that the essays written by Indonesian native learners' were lexically richer, followed by Korean and Tagalog.
This data exactly corresponds to the inter-language genetic proximity between the language languages (i.e. the lexical relatedness between languages as measured on the "Genetic proximity calculator” on this site: http://www.elinguistics.net/Lexical_comparison.html ). According to it, the Indonesian, Korean and Tagalog are related to English in the following order: Indonesian, Korean and Tagalog.
This data exactly corresponds to the inter-language genetic proximity between the language languages (i.e. the lexical relatedness between languages as measured on the "Genetic proximity calculator” on this site: http://www.elinguistics.net/Lexical_comparison.html ). According to it, the Indonesian, Korean and Tagalog are related to English in the following order: Indonesian, Korean and Tagalog.
2
.Similarly, ChineseMandarin and TaiwanMandarin have the same value of both, the TTR median and the language genetic proximity with English.
3
.However, we cannot ascertain a direct correlation of the median TTR and theoretical linguistic similarity measurements since certain exceptions do exist. For example, out of all the languages in question, Urdu has the greatest lexical similarity to English. However, the same is not reflected by the TTR Value.
Word frequency (with and without stopwords)
Word frequency (with and without stopwords)
Word Cloud for the top 20 words used in the essays (without removing the stopwords)
1
.From these word clouds, we can recognise that the essays for all the languages make rich use of determiners (focus on "the" and “a”). Therefore, # of determiners will not probably not be the discriminative feature for classifying the essays using Machine Learning.
2
.To extract more native-language specific information from the word clouds, I removed the stop words from the unigrams.
Word Cloud for the top 20 words used in the essays (after removing the stopwords)
3
.From each of these word clouds, we can make out that the learners from all the language groups have in general a negative sentiment about smoking in restaurants, with all of them citing a risk of cancer, need for government interventions, etc. as arguments for the essay.
4
.Spotting Japan: the word cloud for Japanese has the word “Japan” in it. Essay-writers tend to cite culture/country specific entity names in their essays. We can take a lesson this inference and use Named Entity Recognition to extract Country/President/Festival/Monument names from essays and using them as features to identify native languages.
Frequency of POS (Parts of Speech)
Frequency of POS (Parts of Speech)
1
.From the given word cloud, we realise that although the majorly used POS Tags are the same for each language (Verbs, Prepositions, Nouns, Determiners), there do exist granular differences in the frequency of other POS Tags like WhAdverbs, Interjection. This leads me to conclude that there is still some value in using uni-grams, however extracting and using n-grams of higher orders (2-4) could be more helpful.
2
."Wait, this isn’t English!”: We can observe the occurrence of “ForeignWords” for certain word clouds (like those of Indonesian, Japanese). This means that language learners have a probable tendency to switch to their native language while writing essays. We can take a lesson this inference and add a Language Identification Module to our classification pipeline.
Conclusion
Conclusion
◼
For my project, I analysed the essays written by Asian ESL Learners on the topic of "Non-Smoking in Restaurants" and conducted a statistics and linguistics-motivated analysis on them.
◼
I visualised the word count and sentence count across the essays of all the given languages and observed differences in them. This led me to conclude that document-level features can indeed be used as essay features for identifying the native language using machine learning.
◼
I also visualised the Type-Token Ratios of the essays of all the language learners and observed that the comparison of median TTR Values from all the languages corresponded with theoretical linguistic similarity of the languages with English. However, this is not a robust inference.
◼
I visualised the word uni-grams of the essay and realised the value of using country/cultural specific named entities as features to identify native languages.
◼
I visualised the POS uni-grams of the essay and realised the value of adding a Language Identification Module to the classification pipeline.
Further Scope of Study
Further Scope of Study
I aim to improve my project in the following ways :
◼
By visualising word n-grams of order greater than 1.
◼
By visualising POS n-grams of order greater than 1.
◼
By building helper functions to extract character n-grams and feeding them to an SVM-based Machine learning classifier to classify the essays.
Wow, so much to learn just from a dataset of English Essays?!
You bet! :)
References
References
1. Smith, T. (2020). The citation manual for students: A quick guide (2nd ed.). Wiley
2. Dras, M. & Malmasi, S. (2017) https://arxiv.org/pdf/1703.06541.pdf?forcedefault=true
3. Compare languages: genetic proximity calculator . eLinguistics . http://www.elinguistics.net/Lexical_comparison.html
4. Ciobanu, A.M. , Dinu, L.P., Zampieri, M. (2017). Native Language Identification on Text and Speech
5. Ishikawa, S. (2021). ICNALE: The International Corpus Network of Asian Learners of English http://language.sakura.ne.jp/icnale/download.html