Color is an intrinsic part of how we perceive our world - and it is what makes it so beautiful and vibrant -, a biological reaction triggered by light, a physical entity. Thus, understanding the nature of light and how it interacts with our environment is crucial to understanding what is color. Throughout history, from ancient Greeks to modern era, we have understood the nature of light in different forms, and currently we know it behaves like both a wave and a particle. The characteristics of light affect the way we see different colors, influenced by different factors, such as the way light is absorbed, reflected, refracted, or scattered. These processes can not only impact how colors are perceived but can even change the way objects appear to us. Moreover, the way light is emitted from different sources can also impact the colors we see. For instance, the sun emits light across a wide range of wavelengths, which creates a natural spectrum of colors. Similarly, the light emitted from different objects can create a unique spectrum of colors, which can help us identify and differentiate between objects. Understanding the science behind the colors we see is critical in various fields, including photography, art, and design. In this blog post we deal with the physics of light that triggers the color sensation; an introduction to a later exploration of the intricate aspects of color processing in the eye and brain that will be the subject of another blog post.
Color is a perception of light, but what is light?
Color is a perception of light, but what is light?
Intrinsically, color is an interpretation of the brain of the light interacting with the eyes, and in particular with the retina which plays a crucial role in how we perceive colors.
The way light interacts with the retina and the different cells present within it can alter our perception of colors (we will explore in detail the eye, retina and mechanisms that allow light and color perception in a further post). To understand this interaction, we must start by remembering some of the basis of the nature of light.
From daily experience we can notice that light seems to propagate in straight lines, which can lead to hypothesize that it consists of particles that interact with matter like discrete bullets. Nevertheless, some phenomenas such as diffraction and interference, could be better explained by a wave theory of light.
From Newton’s corpuscular theory and Thomas Young's double-slit experiment in the early 19th century, the understanding nature of light has changed and included both theories, ultimately co-existing in the known as wave-particle duality. Let us dive a bit into what these theories mean.
The electromagnetic wave
The electromagnetic wave
In the 19th century, James Clerk Maxwell set the foundations for the understanding of light as a type of electromagnetic radiation that travels in waves, with its behavior characterized by its wavelength, frequency, phase, and amplitude.
As a wave, light can be described as a series of peaks and troughs that move through space. When light waves of different wavelengths combine, they can create complex patterns of interference and diffraction.
As a wave, light can be described as a series of peaks and troughs that move through space. When light waves of different wavelengths combine, they can create complex patterns of interference and diffraction.
For example, we can visualize the diffraction pattern produced by a monochromatic source of light by solving Maxwell’s equations in the Fraunhofer approach [1] resulting the following plots for a rectangular source (left) and a circular (right)
Define parameters, wavelength, radius of circle, rectangle sides and propagation distance
In[]:=
λ=0.632;r=10λ;z=1000λ;a=5λ;b=6λ;
Compute the diffraction pattern with theoretical expressions
GridDensityPlot,{x,-z,z},{y,-z,z},AspectRatioAutomatic,ColorFunctionGrayLevel,ImageSize400,PlotPoints->150,DensityPlot,{x,-z,z},{y,-z,z},ColorFunctionGrayLevel,ImageSize400,PlotPoints->150
2
SincSinc
πax
λz
πby
λz
2
2
BesselJ[1,πSqrt[(+)]r(λz)]
2
x
2
y
πSqrt[(+)]r/(λz)
2
x
2
y
Out[]=
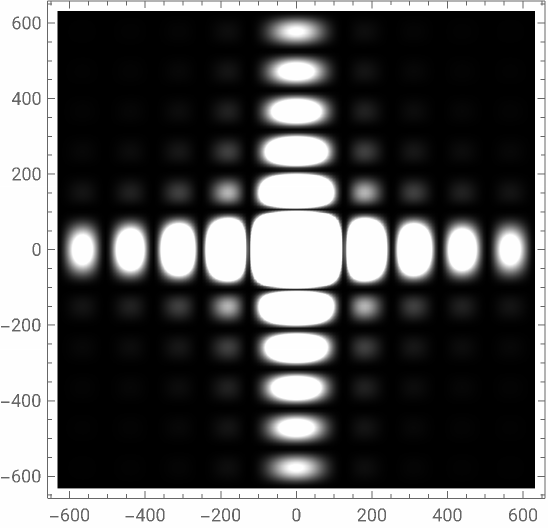
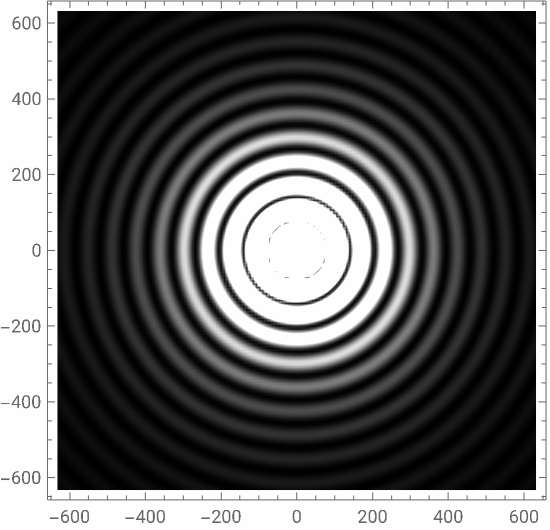
Intensity of Fraunhofer diffraction pattern produced by a rectangular slit (left) and a circular aperture (right) where white represents more light.
These phenomenons are typically impossible to explain without understanding light as a wave and usually give rise to many complex behaviours, specially at scales relatively similar to the wavelength of the light.
The wavelength is not only a scale parameter but it also defines other properties of electromagnetic waves, more importantly for this exploration, for visible electromagnetic waves (or light) different colors of light have different wavelengths.
Knowing this it is possible to create more interesting (and beautiful) patterns for instance using more powerful functionalities that allow the computation of an iridescent interference pattern.
In this case, red, green, and blue light is passing through two small pin-holes in a light-blocking screen, creating and interference pattern of fringes.
Compute the non-paraxial interference pattern of two point sources for red, green and blue light
In[]:=
Out[]=
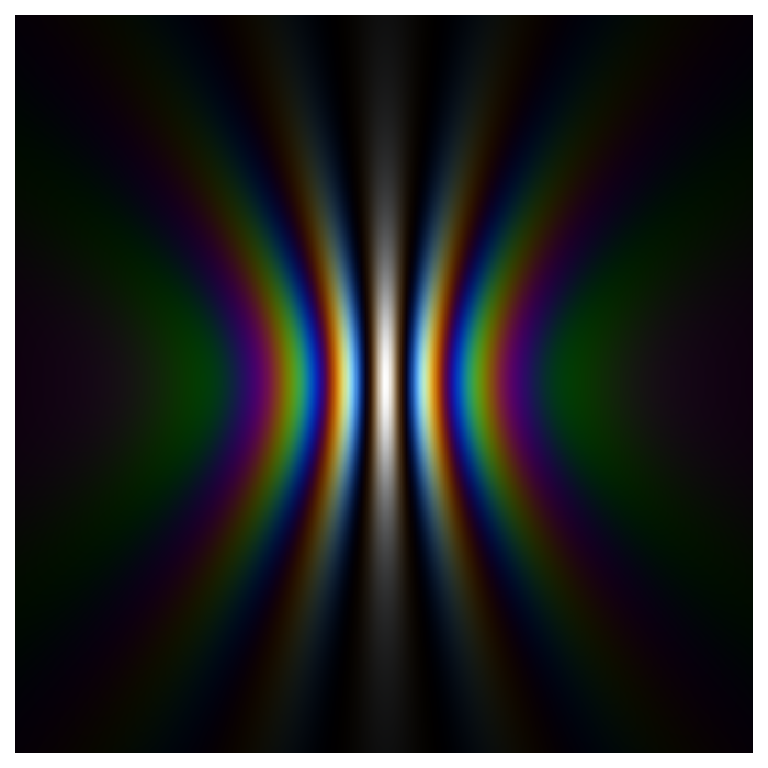
Iridescence diffraction pattern produced by a Young-like experiment using red, green and blue light
To perform this computation, the OpticalFieldModeling function from the Wolfram Function Repository was used to calculate the pattern produced by each wavelength (or color) in a Young-like experiment and using the additive property of colors and the function ColorCombine, the iridescence is simulated.
The presence of white light in the center reminds the basic behaviour of a prism illuminated by white light, that produces the well-known decomposition of all colors. Many demonstrations can be found in the Wolfram Demonstration Project website, like the following where you can see the dispersion produced as function of the prism incidence angle


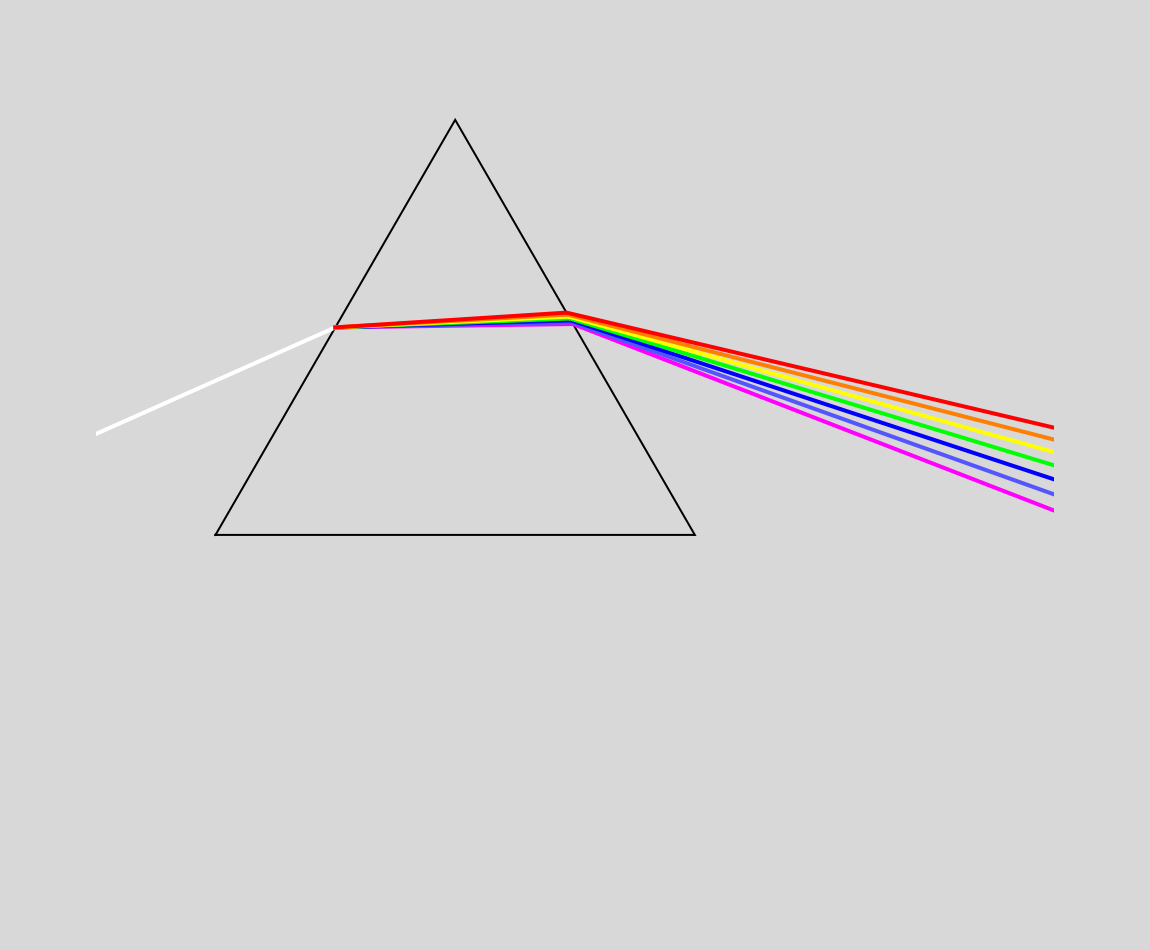
Dispersion of white light through a prism as the incidence angle is varied.
Taken from “Dispersion of Light through a Prism”. Contributed by: Siva Perla (August 2007). Open content licensed under CC BY-NC-SA
Taken from “Dispersion of Light through a Prism”. Contributed by: Siva Perla (August 2007). Open content licensed under CC BY-NC-SA
In summary, the electromagnetism theory describe light as a wave and thus exhibiting wave-like properties and behaviours like refraction, diffraction and interference. This is specially important to understand how physically all colors merge and blend.
The quantum particle
The quantum particle
Light also behaves like a stream of particles called photons, the fundamental particle of electromagnetic radiation. In strict terms, this is a definition from quantum mechanics which describes the photons as the local and energetically smallest possible excitation of the electromagnetic field.
Each photon carries a specific amount of energy, and the energy of a photon is proportional to its frequency, or equivalently, its color as where is the energy, is Planck’s constant and is the frequency of the Photon.
The particle-like nature of light is particularly useful in explaining certain phenomena, such as the photoelectric effect. In this effect, electrons are emitted from a metal surface when light shines on it. The energy of the photons is transferred to the electrons, allowing to escape the metal surface.
Each photon carries a specific amount of energy, and the energy of a photon is proportional to its frequency, or equivalently, its color as
E=ℏν
E
ℏ
ν
The particle-like nature of light is particularly useful in explaining certain phenomena, such as the photoelectric effect. In this effect, electrons are emitted from a metal surface when light shines on it. The energy of the photons is transferred to the electrons, allowing to escape the metal surface.
The photoelectric effect is a phenomenon of light absorption but the emission of light is also explained by quantum mechanics where the transition of electrons to lower energy levels in their orbits around the atomic nucleus is accompanied with the emission of a photon of energy equal to the difference between the two energetic states of the electron.
In general, quantum mechanics describes the generation and absorption of light as transition of electrons, giving arise to effects like the light-electron scattering or Laser.
In general, quantum mechanics describes the generation and absorption of light as transition of electrons, giving arise to effects like the light-electron scattering or Laser.
In summary, light has a dual nature, behaving both as a wave and as a particle. The particle-like behavior is useful for explaining energy transfer and generation/absorption at the atomic level.
If it is both, how does it interact with everything else?
If it is both, how does it interact with everything else?
Reflection, and Refraction
Reflection, and Refraction
Light reflection and refraction are two fundamental properties of light that describe how it interacts with different materials and surfaces.
Reflection is the process by which light bounces off a surface, following the law of reflection, which states that the angle of incidence is equal to the angle of reflection .
Reflection is the process by which light bounces off a surface, following the law of reflection, which states that the angle of incidence
θ
i
θ
r
In[]:=
Out[]=
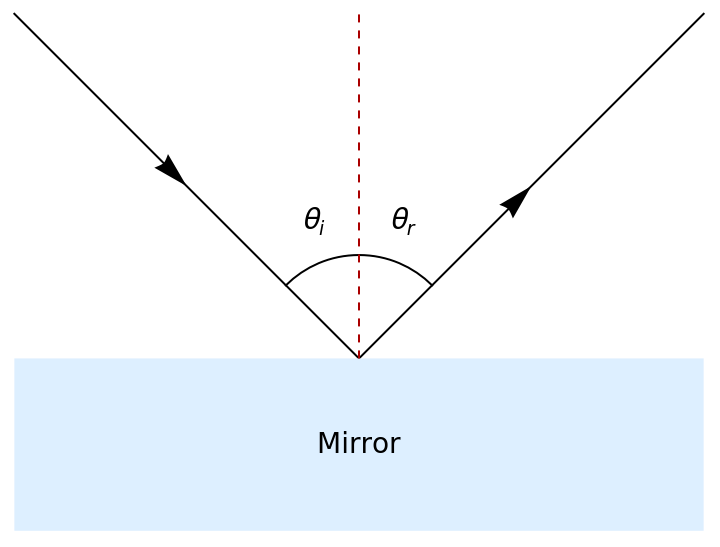
When light encounters a smooth surface, such as a mirror or a still pool of water, the reflection can be very clear and distinct. However, if the surface is rough or uneven, the reflected light will be scattered in various directions, resulting in diffuse reflection.
A fun demonstration from Stephen Wolfram to be used to see how light will reflect on a polynomial mirror:
A fun demonstration from Stephen Wolfram to be used to see how light will reflect on a polynomial mirror:
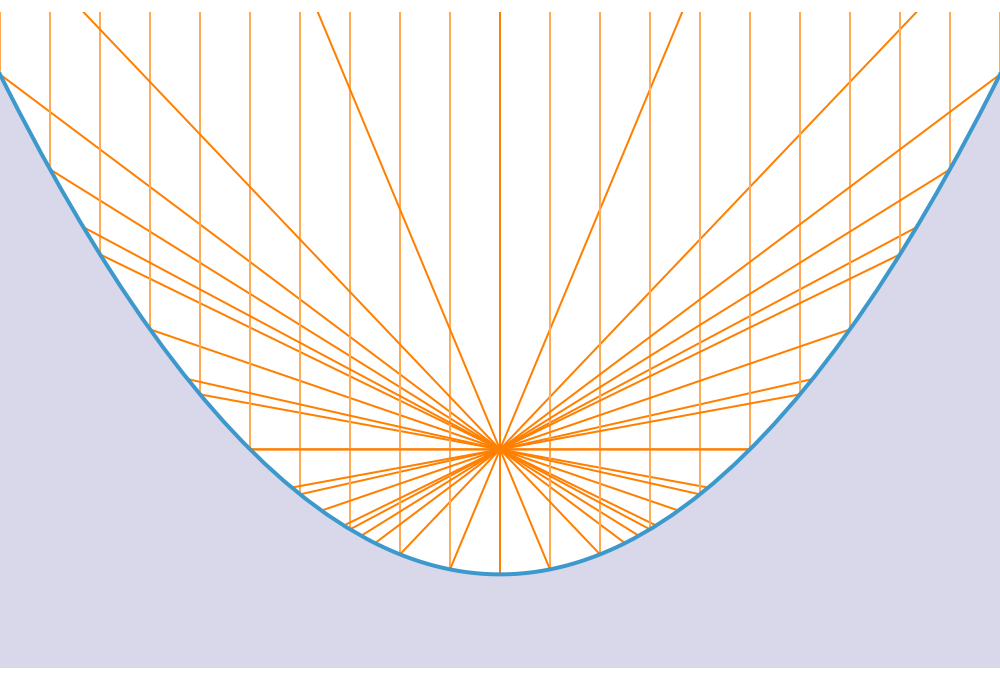
Reflection from a Polynomial Mirror
Taken from”Reflection from a Polynomial Mirror”. Contributed by: Stephen Wolfram (March 2011). Open content licensed under CC BY-NC-SA
Taken from”Reflection from a Polynomial Mirror”. Contributed by: Stephen Wolfram (March 2011). Open content licensed under CC BY-NC-SA
Refraction, on the other hand, is the process by which light changes direction as it passes from one medium to another. When light travels through a transparent material, such as air, water, or glass, it can be bent due to differences in the refractive indices of the two materials.
The amount of bending, or the angle of refraction, is determined by Snell's law, which relates the angle of incidence and the refractive indices of the two materials.
The amount of bending, or the angle of refraction, is determined by Snell's law, which relates the angle of incidence and the refractive indices of the two materials.
Snell’s law where n is the refractive index of the medium and θ is the angle with the normal
Using this equation we can add to the previous graphics a refracted ray:
In the graphics, we are representing light as rays, but we mentioned they are waves too so in reality we should think about these phenomenas occurring to the wave front of an electromagnetic wave. This is nicely illustrated by Todd Rowland here:
Taken from”Snell's Law of Refraction (Wave Fronts)”. Contributed by: Todd Rowland (March 2011) and suggested by: Stephen Wolfram. Open content licensed under CC BY-NC-SA
Refraction is responsible for a variety of optical phenomena, such as the bending of light in lenses, the formation of rainbows, and the mirage effect. It is also used in many practical applications, including the design of optical instruments, the correction of vision problems with eyeglasses and contact lenses, and the measurement of the refractive properties of materials.
Scattering
Scattering
Light scattering refers to the process by which light is redirected in different directions as it interacts with matter. When light encounters small particles or irregularities in a medium, such as dust, air molecules, or water droplets, it can be scattered in various directions due to refraction, diffraction, and reflection.
There are several types of light scattering, including Rayleigh scattering, Mie scattering, and Raman scattering. Rayleigh scattering occurs when the size of the scattering particles is much smaller than the wavelength of the incident light, while Mie scattering occurs when the size of the particles is comparable to or larger than the wavelength of the light. Raman scattering occurs when light interacts with the vibrations and rotations of molecules in a material, resulting in a shift in the frequency of the scattered light.
Scattering plays an important role in many natural phenomena, such as the blue color of the sky, the red color of sunsets, and the appearance of clouds. It is also used in a variety of scientific and technological applications, including remote sensing, atmospheric monitoring, and particle analysis.
A fun illustration of how the angle of incidence between the sun and the observing point on the surface of earth changes the color of the sky during a sunset can be seen by S. M. Blinder here:
Taken from”Blue Sky and Red Sunset”. Contributed by: S. M. Blinder (July 2012) . Open content licensed under CC BY-NC-SA
Where does light come from then?
Where does light come from then?
The blackbody radiation
The blackbody radiation
We can now go a deeper into how light is generated. To understand this, the black body is introduced as a theoretical object that absorbs every electromagnetic radiation that falls on it, this means that no light would be reflected or transmitted from such object, thus it would appear black to the eye and hence the name.
Therefore, this black object would emit a continuous spectrum of electromagnetic radiation that only depends on its temperature.
The equation that describes the intensity of the radiation emitted by a blackbody of temperature T is also known as Planck's law, coming from the distribution of states in the electromagnetic field with respect to the energy and is given by
Blackbody radiation formula where I is intensity, λ is wavelength, T is temperature and h, K, and c are Planck’s, Boltzmann, and speed of light constants, respectively
We can compare the intensity at each wavelength for a given temperature, like for instance the effective temperature of the sun and the melting temperature of the tungsten.
Compare the temperature of the sun and the melting point of tungsten
This tells us that warm objects glow and warmer objects glow more, as well as it gives us a relationship between the wavelength (or color) of the light that is produced by the glowing object in a continuous spectrum, therefore it is possible to conclude that the tint of “white” illumination can be describe by a temperature. Let’s explore this more.
The color of temperature
The color of temperature
To relate the wavelength to a color based on the human vision, the Commission Internationale de L'Eclairage (CIE) or International Commission on Illumination in English has defined a system, the CIE XYZ, to compute a triple of numerical components that are the mathematical coordinates of color space, a model that represents the range of colors that can be displayed or represented in a digital image, on a screen, or in a physical output like a print.
This system is based on the description of color as a luminance component Y and two additional components X and Z. XYZ tristimulus values are positive quantities that can describe any color. A chromaticity plot can help understand the mapping of the values onto colors.
This system is based on the description of color as a luminance component Y and two additional components X and Z. XYZ tristimulus values are positive quantities that can describe any color. A chromaticity plot can help understand the mapping of the values onto colors.
Import weighting spectral functions
Plot weighting spectral functions
This weighting functions are therefore replicating the color sensitivity of the human eye to try to write colors in a coordinate system that can be easily used to translate between values to actual human perception.
Having this, we can use the blackbody radiation formula to compute the spectral radiance of a source at a given temperature:
Having this, we can use the blackbody radiation formula to compute the spectral radiance of a source at a given temperature:
Define the blackbody radiation function of the wavelength and temperature
With this we can now compute the values for a range of temperatures
Compute the XYZ values
Now, we can use the XYZColor built-in function to display the color:
Display XYZ colors of the associated temperature
Or we can convert them to the usual RGB, that represents colors in terms of the intensities of red, green, and blue light, useful as most digital images and web content use the RGB color space:
Display RGB colors of the associated temperature
The result matches the typical real-life experience where hot objects glow red and the hotter they get, they look whither and then light blue.
White point temperature is a term used in color science to describe the color balance of a light source or a display, based on the temperature at which an ideal “white” light appears to the human eye. The white point temperature is usually expressed in degrees Kelvin (K), and it represents the temperature at which a blackbody radiator would emit a white light with a particular chromaticity, or color tone.
The concept of white point temperature is closely related to the idea of color temperature, which is a measure of the spectral properties of a light source. The color temperature of a light source can have a significant impact on the perceived color of objects and scenes, especially in photographic or design applications where accurate color reproduction is important.
By specifying a white point temperature, designers and color experts can establish a consistent color balance across different devices or media, ensuring that whites and other neutral tones appear consistent and natural to the human eye. Common white point temperatures include 6500K (commonly used for indoor lighting and computer displays), 5000K (often used for daylight simulations), and 9300K (used for high-end photographic applications).
Visible light spectrum
Visible light spectrum
So far, it was mentioned several times that wavelength and frequency can be related to the color of visible light but it is not clear how, thus let’s explore this.
The atmosphere plays an important role in the spectrum of light because it can scatter, absorb, and refract different wavelengths of light. The composition of the atmosphere and its density can affect how light interacts with it, leading to changes in the color and intensity of light that reaches the Earth’s surface.
For example, blue light is scattered more easily than other colors, which is why the sky appears blue. Similarly, the Earth’s atmosphere absorbs certain wavelengths of light, such as ultraviolet radiation, which is harmful to living organisms. Understanding how the atmosphere interacts with light is important for a range of applications, including atmospheric science, remote sensing, and astronomy.
Considering the effect of the atmosphere, let us calculate the equivalent color of a range of wavelengths in the visible spectrum.
The CIE has also established the CIE standard illuminant D65, that gives us the daylight spectral distribution.
Import the D65 daylight spectral distribution
Typically, a polynomial approximation is used to get a smoother version of the data:
Plot the D65 and its 5th order polynomial approximation
This spectral distribution can be used to obtain the colors associated to the human vision, nevertheless, a simplified version is to assume a uniform unitary spectral distribution and following the same procedure as in the last section, we can compute the XYZ values for a range of wavelengths.
Compute the XYZ values
And display the corresponding color:
Compute the associated color of each wavelength in the human vision
One of the main advantages of the visible spectrum is that it is able to penetrate the atmosphere and water, allowing organisms to see objects and navigate through their surroundings. Other types of electromagnetic radiation, such as ultraviolet or infrared light, may be absorbed or scattered by atmospheric gases or water, making them less useful for visual communication and navigation.
Chromaticity plots
Chromaticity plots
It is typically a good idea to study your working color space using a chromaticity plot, a graphical representation used to describe the perceived colors of light sources or colors in the visible spectrum
The diagram is usually a two-dimensional graph, with two primary coordinates (x, y) representing the color of a light source or color stimulus. These coordinates are calculated from the tristimulus values of the light or color.
See for example the chromaticity plot of the XYZ color space. The numbered line with the visible spectrum enclose all the the pure spectral colors that can be perceived by the human eye enclose.
Nevertheless, most digital images and web content use the RGB color space, and many image editing software and devices work with RGB values to represent and manipulate colors. Here we can see enclosed by the blue line the colors that are representable using the RGB color space.
When working with digital images, it’s essential to consider the gamut of the color space to ensure that colors are accurately represented and preserved during editing, printing, or displaying on different devices. For example, we can compare the RGB color space designed and used by Apple with the one used by the Adobe products.
In this case, AdobeRGB was designed to encompass a broader range of colors, especially those that can be reproduced by typical CMYK printing processes. It has a larger gamut compared to sRGB and Apple RGB, and it includes more vibrant greens and cyans. This makes it a preferred choice for professional photographers and designers who want to ensure that the colors in their images are accurately represented when printed or displayed on wide-gamut monitors.
In this way, it is possible to consider which color space will be able to reproduce better the colors in your image:
In this way, it is possible to consider which color space will be able to reproduce better the colors in your image:
In summary, a chromaticity plot provides a standardized and intuitive way to describe colors and their relationships, making it a valuable tool in various fields involving color science and technology.
That’s light (in a nutshell)
That’s light (in a nutshell)
We have set down the basic information that we need to try to understand what is color, how we represent it mathematically and computationally and why we should care about it. Concepts like color temperature and chromaticity plots were covered briefly but will expanded in further posts where we will attempt to illuminate the nature of color.
References
References
1
.Born, M. and Wolf, E. “Elements of the Theory of Diffraction” and “Rigorous Diffraction Theory.” Chs. 8 and 11 in Principles of Optics: Electromagnetic Theory of Propagation, Interference, and Diffraction of Light, 7th ed. Cambridge, England: Cambridge University Press, pp. 370-458 and 556-592, 1999.
2
.Hecht, Eugene (2002). Optics. Addison-Wesley. p. 101. ISBN 0-321-18878-0.
3
.Mandel, L.; Wolf, E. (1995). Optical Coherence and Quantum Optics. Cambridge University Press. ISBN 978-0-521-41711-2.
4
.Planck, M. (1914). The Theory of Heat Radiation. Masius, M. (transl.) (2nd ed.). P. Blakiston’s Son & Co. OL 7154661M.
5
.Berlin, B. and Kay, P., Basic Color Terms: Their Universality and Evolution, Berkeley: University of California Press, 1969.
6
.Waldman, Gary (2002). Introduction to light: the physics of light, vision, and color. Mineola: Dover Publications. p. 193. ISBN 978-0486421186.
7
.CIE (1932). Commission internationale de l’Eclairage proceedings, 1931. Cambridge: Cambridge University Press.
8
.Speranskaya, N. I. (1959). “Determination of spectrum color co-ordinates for twenty seven normal observers”. Optics and Spectroscopy. 7: 424–428.
CITE THIS NOTEBOOK
CITE THIS NOTEBOOK
Illuminating the Secrets of Color 1: Decoding Light
by Julian Laverde
Wolfram Community, STAFF PICKS, July 31, 2023
https://community.wolfram.com/groups/-/m/t/2979903
by Julian Laverde
Wolfram Community, STAFF PICKS, July 31, 2023
https://community.wolfram.com/groups/-/m/t/2979903