Flow Curves of a Herschel-Bulkley Fluid
Flow Curves of a Herschel-Bulkley Fluid


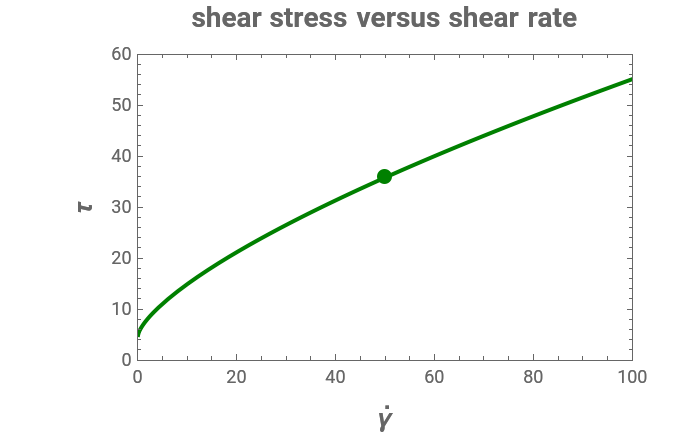
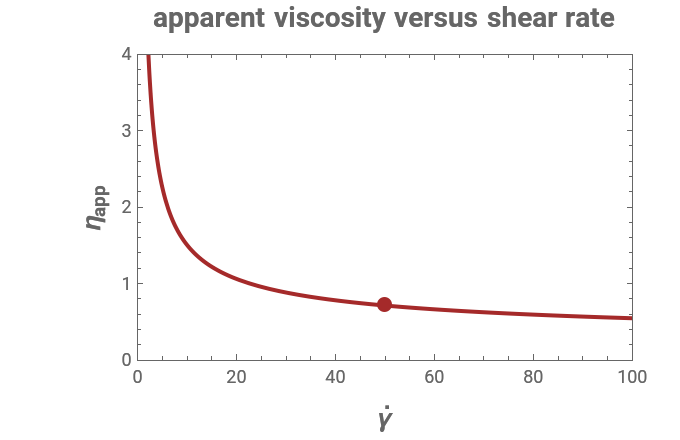
This Demonstration lets you generate and plot flow curves of Newtonian, Bingham, and shear-thinning (pseudoplastic) fluids using the Herschel–Bulkley model. It provides visualization of the differences between Newtonian and non-Newtonian fluids and how they are affected by the yield stress, consistency, and flow index. It also shows how the apparent viscosity of non-Newtonian fluids, unlike that of Newtonian fluids, changes with the shear rate.
Details
Details
This Demonstration plots shear stress versus shear rate and apparent viscosity versus shear rate using the Herschel–Bulkley model, , where is the yield stress (in Pa), the consistency (in ), and the flow index (dimensionless). ( is in Pa and is in Pa s.) The apparent viscosity is calculated as =τ/. When =0 and , the model describes a Newtonian fluid; when >1 and , the model describes a Bingham fluid, and when =0 and , the model describes a pseudoplastic fluid.
τ
γ
η
app
τ=+k
τ
0
n
γ
τ
0
k
Pa
n
s
n
τ
η
app
η
app
γ
τ
0
n=1
τ
0
n=1
τ
0
n<1
The user can enter the fluid's rheological parameters, , , and , a chosen value of , and maximum values of the plots' ordinates with sliders. The panel displays the numeric values of the shear stress and apparent viscosity at the chosen shear rate and plots the corresponding versus and versus for the chosen fluid's parameters. The points and , whose numerical values are displayed, are also shown as movable dots on the corresponding plots.
τ
0
k
n
γ
τ
γ
η
app
γ
(,τ)
γ
(,)
γ
η
app
Snapshot 1: pseudoplastic fluid (no yield stress)
Snapshot 2: pseudoplastic fluid having a high yield stress
Snapshot 3: Newtonian fluid
Snapshot 4: Bingham fluid
Permanent Citation
Permanent Citation
Mark D. Normand, Micha Peleg
"Flow Curves of a Herschel-Bulkley Fluid"
http://demonstrations.wolfram.com/FlowCurvesOfAHerschelBulkleyFluid/
Wolfram Demonstrations Project
Published: March 7, 2011