COVID19: The performance of the Swedish strategy
COVID19: The performance of the Swedish strategy
Christos Papahristodoulou
May 29, 2020
May 29, 2020
Introduction
The three Nordic countries together, Denmark, Norway and Finland had in May 28, almost 200 deaths per million inhabitants from the COVID-19. Sweden, with approximately 60% of the population of the other three countries, had 419 deaths per million. Obviously the COVID-19 pandemic hit Sweden much harder. Today it was announced that the other three Nordic countries will enforce quarantine to travellers from Sweden during the summer. In addition, two Mediterranean countries, Greece and Cyprus, just announced that they do not allow tourists from Sweden this summer.
Stockholm, and particularly its older people who were taken off in elderly houses, has been hit worse. Insufficient protective medical equipment is perhaps the most important factor, when, for instance, part-time young girls working with care provision to the elderly, had no protection at the start of pandemic. Lean production and just-in-time management methods applied over the recent decades left the country with minimal inventories. A political debate is still going on, and a new commission will try to figure out whom to blame.
Meanwhile, the chief epidemiologist Anders Tegnell of the Public Health Authority, in all the press conferences he has held, he always defended the Swedish "open" strategy. While most European countries reduced the number of gatherings to 5 -10 people at the very early dates of pandemic, Sweden kept it to 500 until the end of March, before it reduced it to 50. Swedes who had returned back from their winter holidays (in February) from the skiing resorts in the Alps, where not even checked at the main airports. Instead, they were recommended to stay home if they felt sick. He also allowed the final of the Swedish Eurovision contest to take place in the national stadium in Stockholm in front of 30, 000 on March 7, when the accumulated number of reported infected (mainly in Stockholm), was already more than 160. On the other hand, the Danish contest during the same day in Copenhagen, was performed without public. Denmark implemented lock-down a few days later, but Sweden, never.
Retrieving the data
The first reported infected case in Sweden was in January 31 (a Chinese student who returned from China). The second case was reported in February 26. In order to get continuous estimates I assign the first infected case in February 25, as the start of the Swedish pandemic.
It took about 2 weeks (March 11) to report the first death. The time lag between the infection and death is therefore estimated to be 15 days. There is a divergence between the reported day of deaths and the true death day. There are still 20 deaths that lack the correct day, but are included, since in our data we use the reported day.
In[]:=
inftime=Range[95];(*startFeb25,lastdayMay29*)
The number of infected is obviously a function of the number of tests. Compared to Italy, that has tested approximately 3.7 million (more than 6% of its population), Sweden has tested a small number, approximately 239,000 (i.e. 2.4%). A few weeks ago the government promised to increase its low figures to at least 100,000 tests per week. Still, the actual numbers are approximately 1/3 of that goal. Right now various authorities are debating whom to blame for that failure.
Moreover, the actual infected ratio in Sweden is 15.3%, which is even higher if it compared to the most infected region in Italy, Lombardy, with 88,537 infected out of 727,140 tests.
Moreover, the actual infected ratio in Sweden is 15.3%, which is even higher if it compared to the most infected region in Italy, Lombardy, with 88,537 infected out of 727,140 tests.
In[]:=
infe={1,1,5,4,2,1,1,15,22,42,43,25,41,56,96,142,187,116,124,68,67,107,113,144,200,123,160,110,256,238,296,245,401,243,328,412,512,519,612,365,387,376,487,726,722,544,466,332,465,497,482,613,676,606,563,392,545,682,751,812,610,463,286,695,681,790,428,562,235,404,495,702,705,642,656,401,348,602,637,673,625,470,466,234,422,724,649,637,379,271,384,597,648,639,749};
In[]:=
accinfe=Accumulate[infe];
In[]:=
deadtime=Range[80];(*startMarch11,lastdayMay29*)
In[]:=
death={1,0,0,1,1,4,1,2,2,4,4,3,10,3,6,24,26,10,8,36,34,59,43,51,40,28,76,114,96,106,77,17,12,20,114,170,130,67,111,29,40,185,172,84,131,40,2,80,81,107,124,67,16,10,90,85,87,99,135,45,5,31,57,147,69,117,28,5,19,45,88,40,54,67,6,31,96,95,46,84};(*dailydeathsuntilMay29*)
In[]:=
accdeath=Accumulate[death];
Until today, in May 29, the number of deaths is 4,350. The reported number of deaths during the weekends and holidays is much lower leading to very high deviations. In order to smooth the death data, we can use a moving average of 7 days. Therefore there are 74 observations. If we start with the first moving average in March 11, the last moving average value is in May 23.
In[]:=
deaths=MovingAverage[death,7];
In[]:=
deathstime=Range[74];
In[]:=
Length/@{inftime,infe,deadtime,death,deaths,deathstime}
Out[]=
{95,95,80,80,74,74}
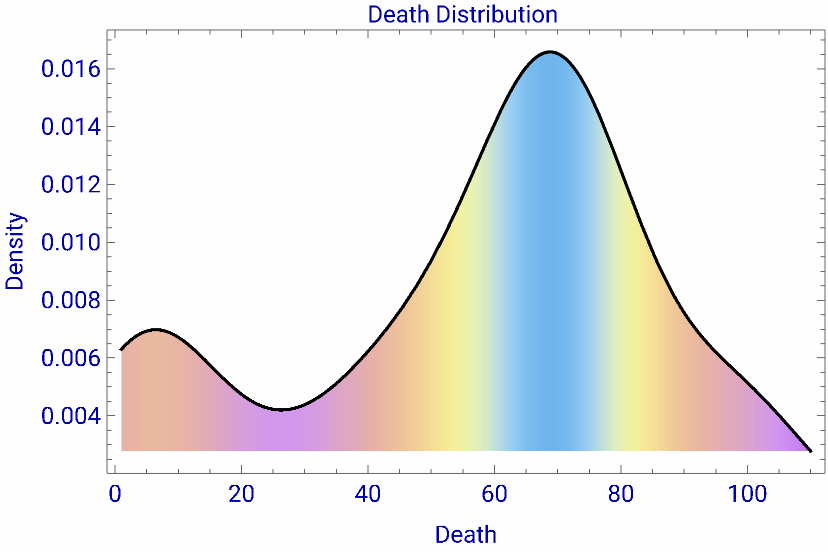
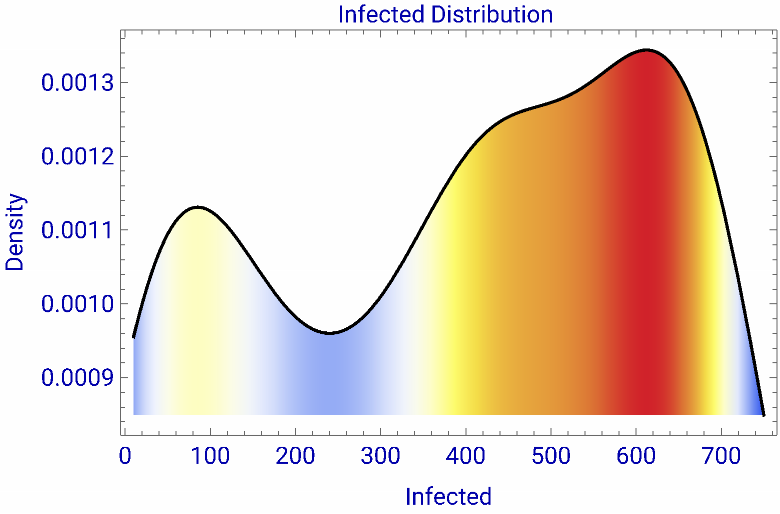
The respective kernel distributions are shown below. They are not normally distributed. The highest density in deaths appear with approximately 70 deaths per day and the highest density of infected appear with about 600 cases per day.
In[]:=
FindDistribution[deaths]
Out[]=
MixtureDistribution[{0.103557,0.588736,0.307707},{LogNormalDistribution[0.738759,0.480125],UniformDistribution[{1.21818,107.459}],NormalDistribution[69.4212,5.66841]}]
In[]:=
1=SmoothKernelDistribution[deaths]
Out[]=
DataDistribution


In[]:=
Show[Plot[PDF[1,x],{x,1,110},FrameTrue,FillingAxis,LabelStyleDirective[Darker[Blue],12],PlotLabelStyle["Death Distribution ",12],FrameLabel{"Death","Density"},AxesFalse,PlotRangeAll,ColorFunction"Pastel"],Plot[PDF[1,x],{x,1,110},PlotStyleBlack]]
Out[]=
In[]:=
2=SmoothKernelDistribution[infe]
Out[]=
DataDistribution
In[]:=
Show[Plot[PDF[2,x],{x,10,750},FrameTrue,FillingAxis,LabelStyleDirective[Darker[Blue],12],PlotLabelStyle["Infected Distribution ",12],FrameLabel{"Infected","Density"},AxesFalse,PlotRangeAll,ColorFunctionFunction[{x,y},ColorData["TemperatureMap"][y]]],Plot[PDF[2,x],{x,10,750},PlotStyleBlack]]
Out[]=
A logistic model
The logistic model is commonly used in epidemiologic studies, with infections or deaths from the pandemic. The rates are very high in the beginning and slow down later.
In[]:=
data=Thread[Join[{deathstime},{deaths}]]//N;
In[]:=
sol=NonlinearModelFitdata,,{{b,0.3},{a,data[[-1]][[2]]},{t0,data[[-1]][[1]]}},t
a
1+
-b(t-t0)
Out[]=
FittedModel
In[]:=
sol["ParameterTable"]sol["AdjustedRSquared"]
Out[]=
Estimate | Standard Error | t-Statistic | P-Value | |
b | 0.340932 | 0.0840583 | 4.0559 | 0.000126466 |
a | 72.7241 | 2.02766 | 35.866 | 3.12582× -47 10 |
t0 | 17.892 | 0.829238 | 21.5765 | 6.65889× -33 10 |
Out[]=
0.953061
In[]:=
sol//Normal
Out[]=
72.7241
1+
-0.340932(-17.892+t)
In[]:=
plot1=Show[Plot[sol[t],{t,1,74},GridLinesAutomatic,FrameTrue,PlotLabelStyle["Sweden: Moving Average Deaths Mar11 - May23",13],PlotRange{{0,74},{-0.5,110}},FrameLabel{"Day","deaths"},LabelStyleDirective[Blue],PlotStyleBlue,PlotLegends{"logistic"},ImageSize->{500,400}],ListPlot[data,PlotStyleRed,PlotLegends{"MovAvg"}]]
Out[]=
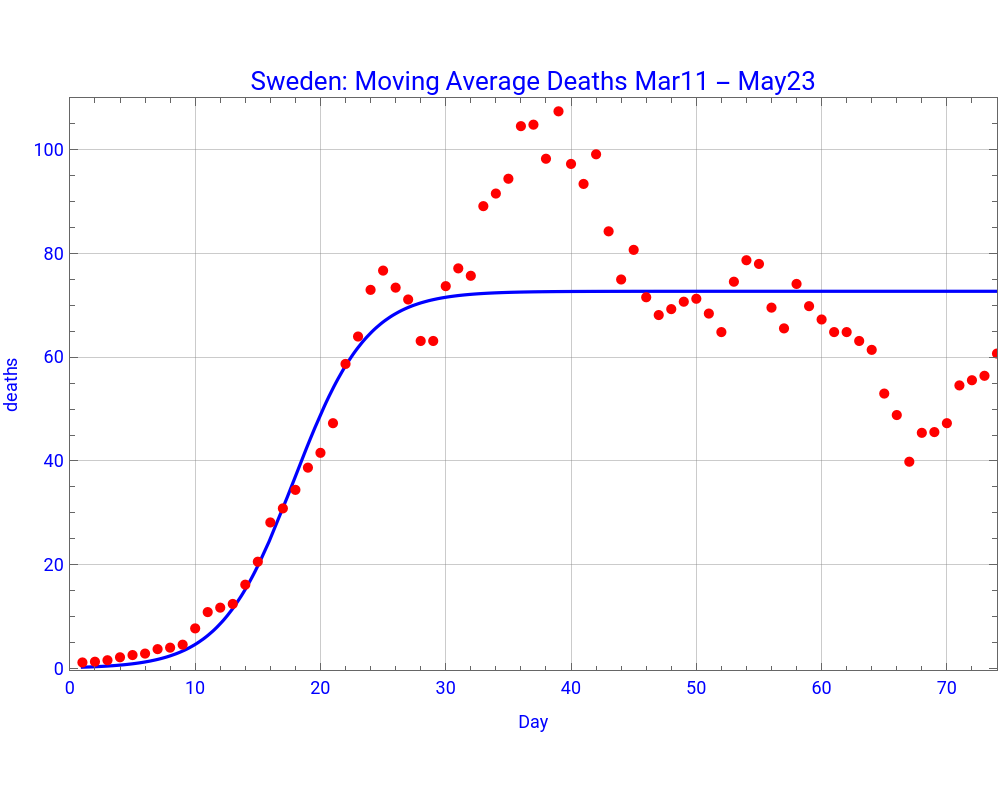


The logistic model predicts that the number of deaths on May 24 should have been, 4,080, compared to the 3,998 which was the accumulated value during that day. Other things being equal, by the end of August (t = 160), the model predicts more than 10,000 deaths.
In[]:=
Integrate,{t,1,74}
72.72410209632051`
1+
-0.34093216873617993`(-17.892020206062725`+t)
Out[]=
4079.73
In addition the following dynamic graph shows that the inflection point took place on day 18 (around end of March). It reached the maximum number of daily deaths 73, at day 35 (just after Easter). The Swedish Public Health Authority believes that the the maximum number of deaths is close to 60. Notice that the first and second derivates are scaled in order to show them in the same graph with the logistic function.
In[]:=
f[x_]:=D1[x_]:=12D2[x_]:=16-p[a_]:={{a,f[a]},{a,D1[a]},{a,D2[a]}}t[x_,a_]:=f[a]+(x-a)f'[a]Manipulate[Plot[{f[x],D1[x],D2[x]},{x,1,72},PlotRange{{1,72},{-0.5,90}},PlotStyle{Blue,Red,Magenta},PlotLegendsPlaced[LineLegend["Expressions",LabelStyleDirective[FontSize12,FontWeightBold]],Below],ImageSize->{500,400},Epilog{PointSize[Medium],Point[p[a]],Darker[Green],InfiniteLine[{p[a][[1]],{0,t[1,a]}}],Text[Style[N[Round[f[a]]],{Blue,"Label"},12],{50,80}],Text[Style[N[D1[a]],{Red,"Label"},12],{8,70}],Text[Style[N[D2[a]],{Magenta,"Label"},12],{8,35}]}],{{a,11,Text[Style[Row[{"day"}],14]]},2,72,1,LabelStyleDirective[Black,14],Appearance->"Labeled"},ControlPlacementTop,AlignmentRight,SaveDefinitionsTrue]
72.72410209632051`
1+
-0.34093216873617993`(-17.892020206062725`+x)
24.79398584708992`
-0.34093216873617993`(-17.892020206062725`+x)
2
(1+)
-0.34093216873617993`(-17.892020206062725`+x)
16.906134732925036`
-0.6818643374723599`(-17.892020206062725`+x)
3
(1+)
-0.34093216873617993`(-17.892020206062725`+x)
8.453067366462518`
-0.34093216873617993`(-17.892020206062725`+x)
2
(1+)
-0.34093216873617993`(-17.892020206062725`+x)
Machine Learning models
Let us now predict the moving average number of deaths per day, using the machine learning models.
Compared to the logistic model, these models show a lower number of deaths and almost identical numbers. For instance, in June 8, the moving average predicted deaths vary from 56 to 60.
Lagged infected and Deaths
Let us now assume that those who are going to die from the COVID-19 virus must have been infected two weeks earlier, i.e. the new deaths (i.e. moving averages), will start from day 15, so that during the first 14 days there will be no deaths. The number of new deaths is therefore 14 + 74 = 88.
We also take the first 88 infected days.
We can visualize the fitted function and the data.
Since the average (daily) infected people reported two weeks earlier was about 600, the expected daily number of deaths currently would be around 72. This indicates a current death ratio of almost 12%. This ratio is higher to the Italian one (deaths, May 29 / infected, May 15) = 10%.
We can also find the probability that an infection number of more than say, 400 will lead to more than 60 deaths.
The probability that more than 60 people will die per day if there had been 400 infected two weeks earlier is 33.4%.
Sweden and 22 other European countries
To compare the “death” performance among countries is problematic, mainly due to three reasons. First, there is no consensus if the reported statistics cover patients who died directly of COVID-19 virus, or the virus weakened their health and in fact died from other underlying diseases. Belgium for instance assign all deaths to COVID-19, while Russia only those who died directly of the virus. Second, some countries might report only cases that had been tested and were found positive, either at hospitals or in other places, such as geriatric homes. Sweden for instance reports even cases that had not been tested before their death. Italy has been criticized that it had not reported around 19,000 who died outside hospitals. Third, some countries, like Italy, were among the first that were hit by the pandemic, while others some weeks later.
Anders Tegnell has always defended his “open” strategy and argued that the Swedish death - ratio was even better compared to some other countries, like Belgium and Italy that had implemented a total “lock-down”. Perhaps it is very early to check the various “lock-down” strategies. Moreover, in this section, I try to test to what extent the “lock-down” had any good effect on the “deaths”/1 million, over two periods. The first is with data from May 6 (which is the day when many countries lessened their hard lock-down). The other is based on the most recent data, May 28. I have constructed a “lock-down” index, mainly based on when the country enforced it. Italy was the first one, March 9, (and gets a value of 6). In fact Italy was very late, because by that day 10,000 had been infected and almost 500 were dead. Spain was also very late. Perhaps a large amount of virus was imported from Bergamo (Lombardy), when thousands of Spaniards travelled there to watch the UEFA CL match between Atalanta and Valencia, in February 19. Already in February 1st, more than 300 COVID-19 patients were treated in hospitals in Lombardy. Sweden never applied a lock-down, but gets a value of 0.2 mainly due to “recommendations” and “social distancing”. Delays in lock-down reduce the value of the index by 0.2 units per day. Belgium, by the way, decided on a lock-down about 10 days after Italy.
Model 1
The relationship is weakly negative, indicating a very weak reduction of deaths/1 million of the lock-down. There is a huge spread of ratios between a minor group of countries above the curve and the majority of countries below the curve. Notice that the Swedish ratio (in a logarithm scale) increased a lot between May 6 and May 28 compared to many countries. A couple of hundred lifes could have been saved if Sweden was on the estimated curve and not above.
Model 2
Similar negative relationship exist with a piecewise function. Again the death figures in Sweden were deteriorated within these three weeks.
Correcting for the size of the country
Obviously to lock - down a large (democratic) country is not that easy and the effectiveness of such a policy is low. Therefore we need to control for their size. Countries with a population larger than 20 million get a dummy 1 and all others 0. The Generalized Linear Model (see below) improves the negative effect on deaths/ratio of lock-down, but still it is not significant. And obviously, big countries have highest death/ratios.
In the graph below, Sweden and the Netherlands (the first two points from the left) are two small countries that have high death-ratios, similar to those that big countries have. On the other hand, two large countries, Germany and Poland (below the surface) have death-ratios equivalent to those of smaller countries.
Conclusion
So far the Swedish “open” or “soft” strategy to compact the COVID-19 has not been successful. Too many deaths, too many infected and still a high death/infected ratio, compared to many other countries that followed a much more restrictive strategy. The Swedish hospitals managed though to keep the curve far below its capacity. On the other hand, given the fact that approximately 2,800 patients have received intensive care so far, and many recovered, it is really sad that many of the 4,350 patients who died never entered the intensive care units and died, either in elderly houses or in standard infection units. Perhaps in a few months we will have more data to evaluate again the success of the Swedish strategy.