The Ponchon–Savarit diagram provides a graphical method for solving coupled material and energy balances in separation processes involving binary mixtures. Here, we illustrate how the Ponchon–Savarit diagram can be computed for a non-ideal binary mixture that has an azeotrope.
Consider a binary mixture of ethanol and water at atmospheric pressure. The gas phase is assumed ideal, but the liquid phase is non-ideal. We plot the Ponchon–Savarit diagram, which is also called the enthalpy-composition diagram. Enthalpy is expressed in kcal/kg and composition is expressed in weight fraction of ethanol. Also shown is the vapor equilibrium curve for ethanol-water. The mole fractions of ethanol in the liquid and gas phases are denoted by and , respectively.
Consider a binary mixture of ethanol and water at atmospheric pressure. The gas phase is assumed ideal, but the liquid phase is non-ideal. We plot the Ponchon–Savarit diagram, which is also called the enthalpy-composition diagram. Enthalpy is expressed in kcal/kg and composition is expressed in weight fraction of ethanol. Also shown is the vapor equilibrium curve for ethanol-water. The mole fractions of ethanol in the liquid and gas phases are denoted by
x
y
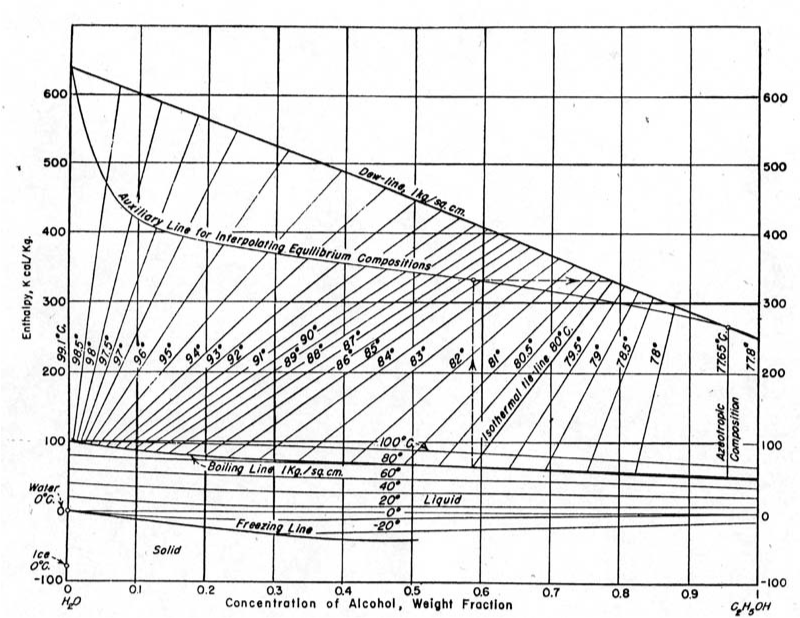
The Ponchon–Savarit diagram for closely agree with Figure 2-4 given in [1] and reproduced below:Finally, the "tie lines", displayed in green, show the composition of the two phases that exist in equilibrium at the specified temperature. At the azeotropic composition the tie line is shown in red; it is vertical, confirming that = at the azeotrope. At , the azeotrope composition in terms of ethanol weight fraction is 96% and the boiling temperature is .
P=760mmHg
x
ethanol
y
ethanol
P=760mmHg
T=78.16°C
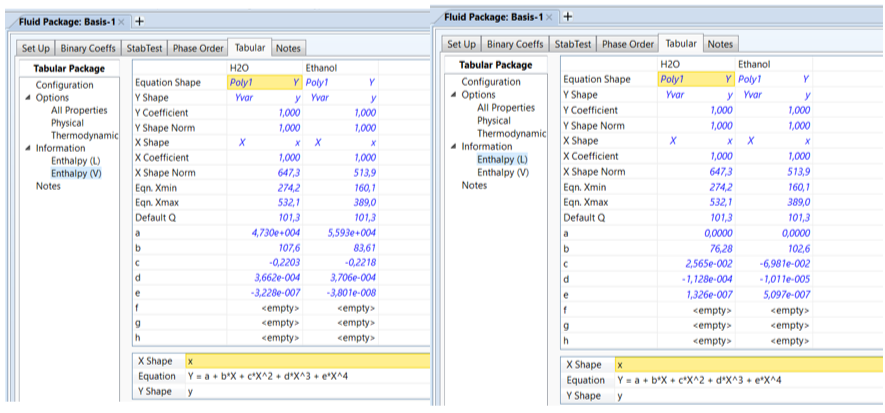
Expressions for pure component vapor and liquid enthalpies were adapted from Aspen-HYSYS (see snapshots below).Aspen-Hysys provides enthalpies above (expressed in ).
0°C
kJ/kmol
Total pressure in mmHg
In[]:=
P=760;
Antoine Constants and equation for ethanol and water.
In[]:=
Aa1=7.68117;Ba1=1332.04;Ca1=199.200;Aa2=8.07131;Ba2=1730.63;Ca2=233.426;Psat1=10^(Aa1-Ba1/(T+Ca1));Psat2=10^(Aa2-Ba2/(T+Ca2));
Binary interaction parameters for the Van Laar activity coefficient model
In[]:=
A12=1.66480;A21=0.94010;Gam1[xa_]:=Exp[A12(A21(1-xa)/(A12xa+A21(1-xa)))^2];Gam2[xa_]:=Exp[A21(A12xa/(A21(1-xa)+A12xa))^2];
Computing VLE data for the binary system: Ethanol and Water
In[]:=
i=0;While[i<1001,{xa=i0.001,sol=FindRoot[Psat1xaGam1[xa]+Psat2(1-xa)Gam2[xa]P,{T,77,78}];xe[i]=xa,ye[i]=Psat1xaGam1[xa]/P/.sol,Te[i]=T/.sol,i++}];Tbl1=Table[{xe[i],Te[i]},{i,0,1000}];Tbl2=Table[{ye[i],Te[i]},{i,0,1000}];Tbl3=Table[{xe[i],ye[i]},{i,0,1000}];Tx=Interpolation[Tbl1,InterpolationOrder1];Ty=Interpolation[Tbl2,InterpolationOrder1];xy=Interpolation[Tbl3,InterpolationOrder1];solaz=FindRoot[xy[t]t,{t,0.9}];
In[]:=
solaz
Out[]=
{t0.904916}
In[]:=
Tx[t/.solaz]
Out[]=
78.1567
In[]:=
A=(0.0+76.28T+2.56510^-2T^2-1.12810^-004T^3+1.32610^-07T^4)/.T(273.15);hl2=0.0+76.28T+2.56510^-2T^2-1.12810^-004T^3+1.32610^-07T^4-A;B=(0.0+102.6T-6.98110^-2T^2-1.01110^-005T^3+5.09710^-07T^4)/.T(273.15);hl1=0.0+102.6T-6.98110^-2T^2-1.01110^-005T^3+5.09710^-07T^4-B;Hv2=47300+107.6T-0.2203T^2+3.66210^-004T^3-3.22810^-007T^4-A;Hv1=55930+83.61T-0.2218T^2+3.70610^-004T^3-3.80110^-008T^4-B;Hvhysys[y_]:=(yHv1+(1-y)Hv2)/.T(Ty[y]+273.15);hlhysys[x_]:=(xhl1+(1-x)hl2)/.T(Tx[x]+273.15);Hw[w_]:=Hvhysys[x]/(18(1-x)+46x)/4.18/.x-;(*vapor-phaseenthalpyinkcal/kg*)hw[w_]:=hlhysys[x]/(18(1-x)+46x)/4.18/.x-;(*liquid-phaseenthalpyinkcal/kg*)yw0=xy-;vw0=46yw0/(46yw0+18(1-yw0));w0az=46t/(46t+18(1-t))/.solaz;yw0az=xy-;vw0az=46yw0az/(46yw0az+18(1-yw0az));
9w
-23+14w
9w
-23+14w
9w0
-23+14w0
9w0az
-23+14w0az
Plot of the Ponchon-Savarit diagram at P=760 mmHg.
Tie-lines are given in Green. Dew line and bubble line are in Yellow and Blue. The tie-line for the azeotrope is given in Red.
Tie-lines are given in Green. Dew line and bubble line are in Yellow and Blue. The tie-line for the azeotrope is given in Red.
In[]:=
p1=ShowPlot[{hw[w],Hw[w]},{w,0,1},FrameTrue,FrameLabel{Style["ethanol weight fraction",14],Style["enthalpy kcal/kg",14]},GridLinesAutomatic,ImageSize{600,350},PlotStyleThick,PlotRange{{0,1},{0,700}}],GraphicsThick,Green,Table[Line[{{w0,hw[w0]},{vw0,Hw[vw0]}}],{w0,0.01,0.04,0.01}],Table[Line[{{w0,hw[w0]},{vw0,Hw[vw0]}}],{w0,0.2,0.9,0.1}],Table[Line[{{w0,hw[w0]},{vw0,Hw[vw0]}}],{w0,0.06,0.14,0.02}],Red,Line[{{w0az,hw[w0az]},{vw0az,Hw[vw0az]}}],Black,TableStyleTextRowToStringNumberFormTx-,{4,2}," °C",{(w0+vw0)/2-0.025,(hw[w0]+Hw[vw0])/2},Automatic,{1000,(hw[w0]-Hw[vw0])/(w0-vw0)},10,{w0,0.2,0.9,0.1},TableStyleTextRowToStringNumberFormTx-,{4,2}," °C",{(w0+vw0)/2-0.025,(hw[w0]+Hw[vw0])/2},Automatic,{1000,(hw[w0]-Hw[vw0])/(w0-vw0)},10,{w0,0.06,0.14,0.02},TableStyleTextRowToStringNumberFormTx-,{4,2}," °C",{(w0+vw0)/2-0.025,(hw[w0]+Hw[vw0])/2},Automatic,{1000,(hw[w0]-Hw[vw0])/(w0-vw0)},10,{w0,0.01,0.04,0.01},Red,StyleTextRowToStringNumberFormTx-,{4,2}," °C",{(w0az+vw0az)/2-0.015,(hw[w0az]+Hw[vw0az])/2},Automatic,{0,1},10
9w0
-23+14w0
9w0
-23+14w0
9w0
-23+14w0
9w0az
-23+14w0az
Plot of the equilibrium curve at P=760 mmHg. The azeotrope is indicated by the Green dot.
Comparing our calculation results and digitized data (shown by red dots) of Figure 2-4 in [1].
Converting weight fraction (digitized data from Fig 2-4 of Ref 1) into mole fractions
Comparing our calculation results and digitized data (shown by red dots) obtained using the tie-lines of Figure 2-4 in [1].
References
References
[1] P. C. Wankat, Separation Process Engineering, 3rd ed., Upper Saddle River, NJ: Pearson, 2012.
CITE THIS NOTEBOOK
CITE THIS NOTEBOOK
Ponchon-Savarit Diagram using Aspen-Hysys Thermodynamic Database
by Housam Binous and Ahmed Bellagi
Wolfram Community, STAFF PICKS, January 13, 2024
https://community.wolfram.com/groups/-/m/t/3102154
by Housam Binous and Ahmed Bellagi
Wolfram Community, STAFF PICKS, January 13, 2024
https://community.wolfram.com/groups/-/m/t/3102154