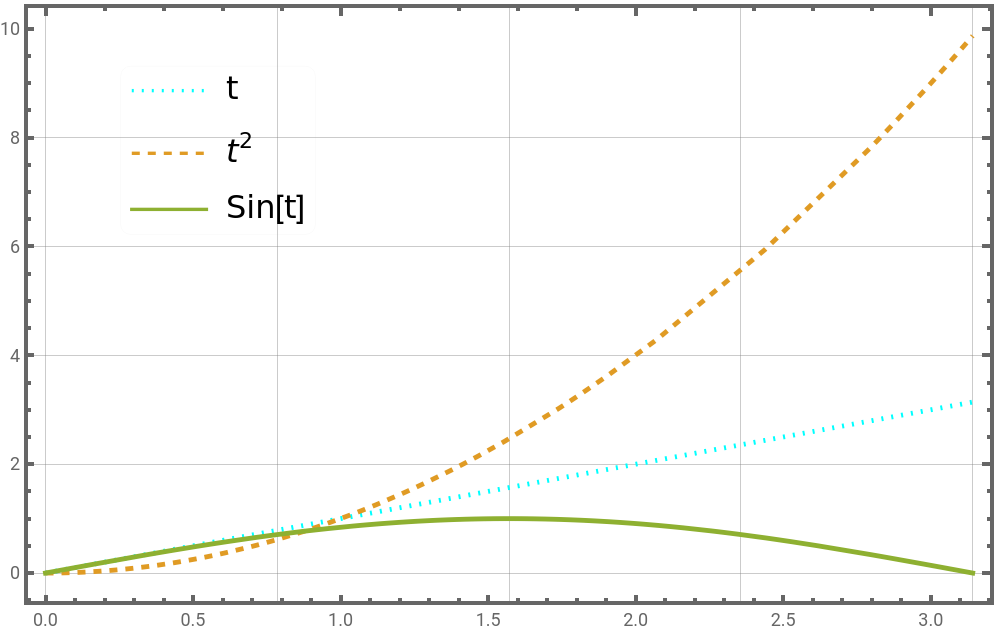
Plot[{t,,Sin[t]},{t,0,Pi},PlotRangeAll,PlotPoints10,FrameTrue,FrameStyleThick,Axes{True,False},PlotLegendsPlaced[LineLegend[{"t","","Sin[t]"},LegendFunction"Frame",LegendLayout"Column"],{{0.3,0.9},{1,1}}],GridLines{Pi*#/4&/@Range[0,4],Automatic},BaseStyle{FontSize15,FontFamily"Times New Roman",Thick},PlotStyle{{Thickness[0.005],Dotted,Cyan},{Thickness[0.005],Dashed},{Thickness[0.005]}},ImageSize500]
2
t
2
t
Out[]=