The new version (1.1.0) of Wolfram ProteinVisualization paclet is live! To access the functionalities of the paclet install and upload the paclet using the following commands.
In[]:=
PacletInstall["WolframChemistry/ProteinVisualization"]
Out[]=

Make sure the latest version (1.1.0) of the paclet is installed. If not you can use the command [] to resolve the issue.
In[]:=
Needs["WolframChemistry`ProteinVisualization`"]
These are the new functionalities of the paclet.
BiomoleculePlot3D
BiomoleculePlot3D
BiomoleculePlot3D can be used to plot the ribbon diagrams of proteins, one of the most common ways to visualize protein structures. Here is the ribbon diagram of the structure of human oestrogen receptor:
In[]:=
BiomoleculePlot3D["1ERE"]
Out[]=
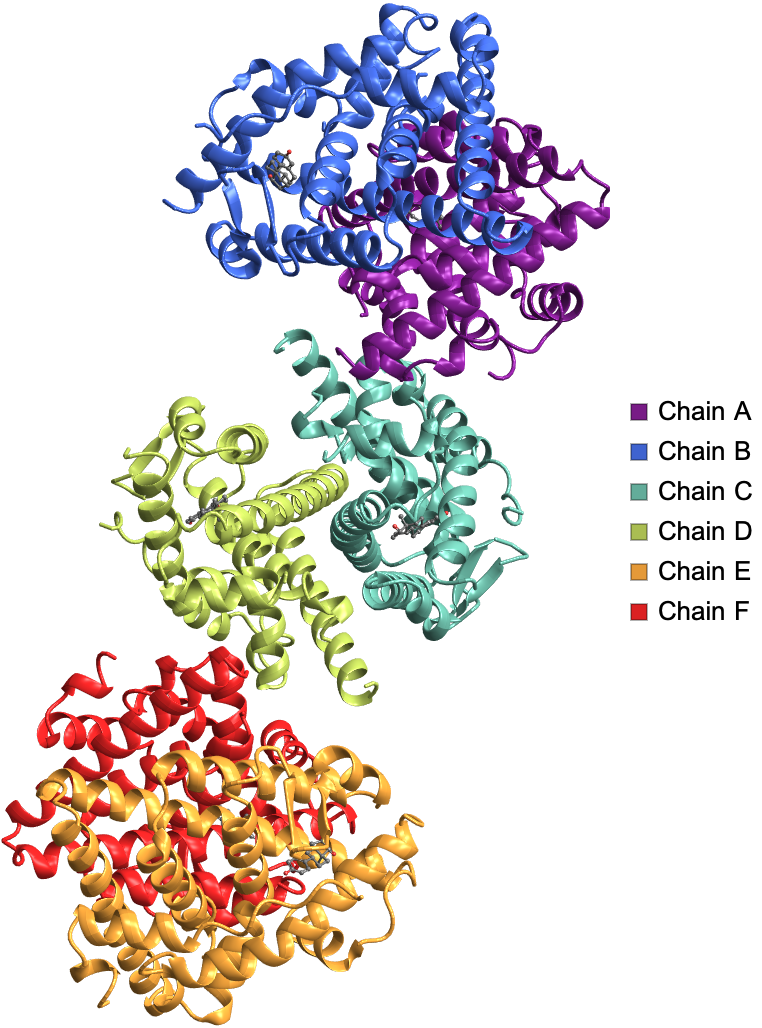
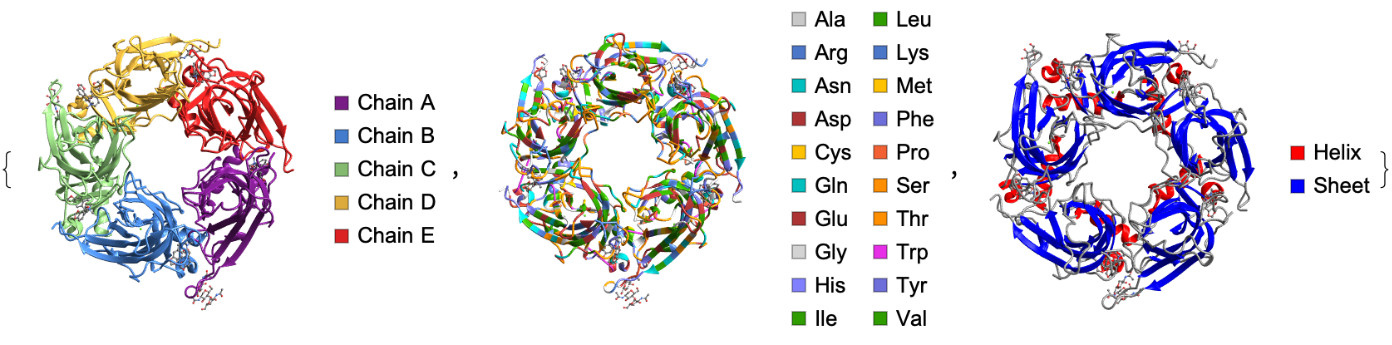
BiomoleculePlot3D comes with a variety of . Usage of two of the options are shown below.
"BackboneColorRules"
"Residues"
"Chains"
"SecondaryStructure"
"Backbone"
"Residues"
"Chains"
"SecondaryStructure"
In[]:=
pdbid="5OBH";{BiomoleculePlot3D[pdbid,"BackboneColorRules"->{"Chains",Automatic}],BiomoleculePlot3D[pdbid,"BackboneColorRules"->{"Residues",Automatic}],BiomoleculePlot3D[pdbid,"BackboneColorRules"->{"SecondaryStructure",Automatic}]}
Out[]=
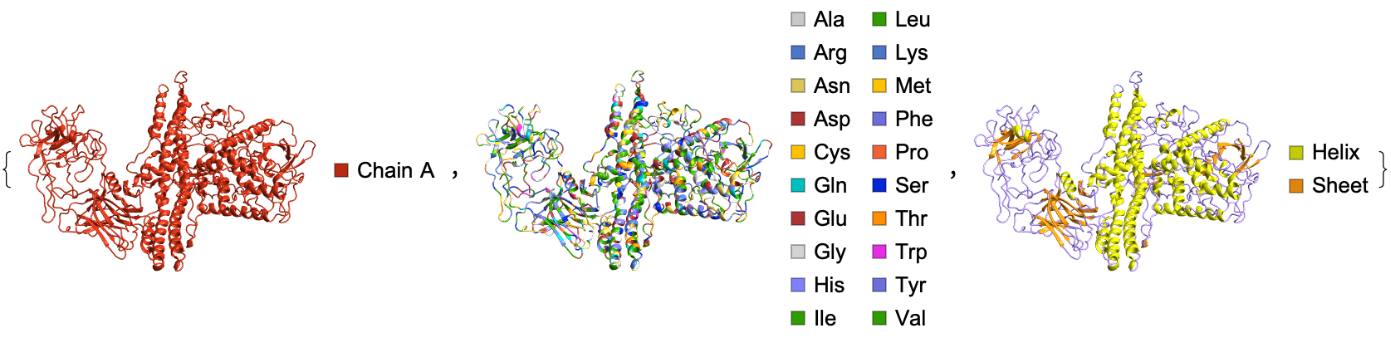
Here is the structure of botulinum neurotoxin type A, specifying colors for chains, amino acids or secondary structure elements:
In[]:=
pdbid="3BTA";{BiomoleculePlot3D[pdbid,"BackboneColorRules"->{"Chains",{"A"->}}],BiomoleculePlot3D[pdbid,"BackboneColorRules"->{"Residues",{"Asn"->,"Ser"->}}],BiomoleculePlot3D[pdbid,"BackboneColorRules"->{"SecondaryStructure",{"Helix"->,"Sheet"->,"Backbone"->}}]}

Out[]=
"BackboneAtoms"
"BackboneAtoms"
In[]:=
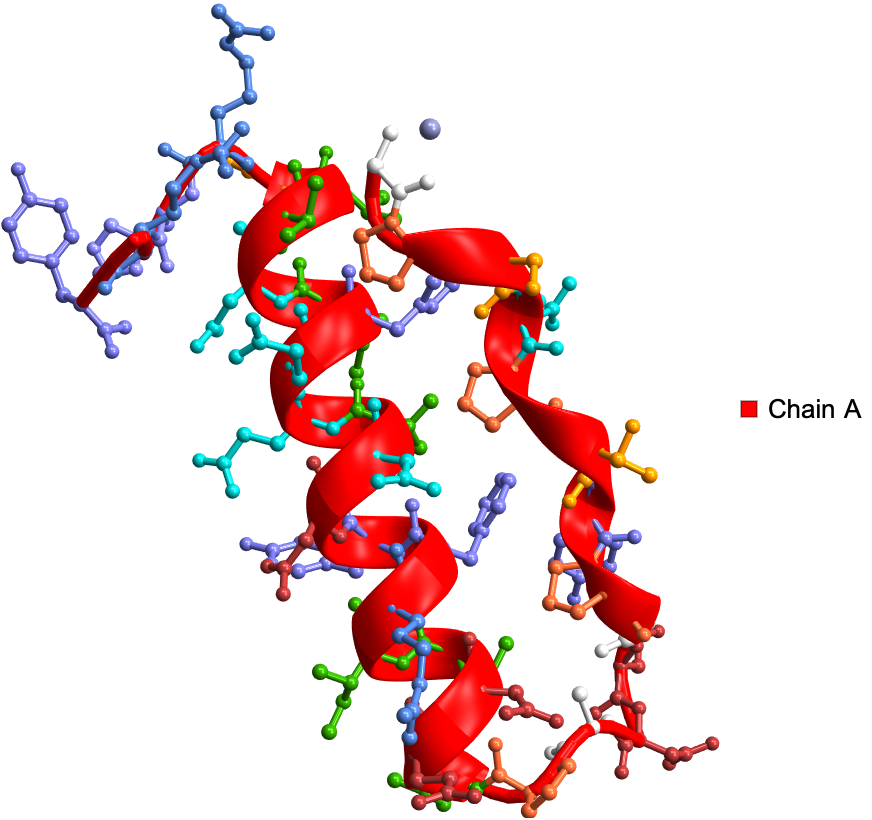
BiomoleculePlot3D["1PPT","BackboneAtoms"->True,"ShowSideChains"->True]
Out[]=
AlphaCarbonPathPlot3D
AlphaCarbonPathPlot3D
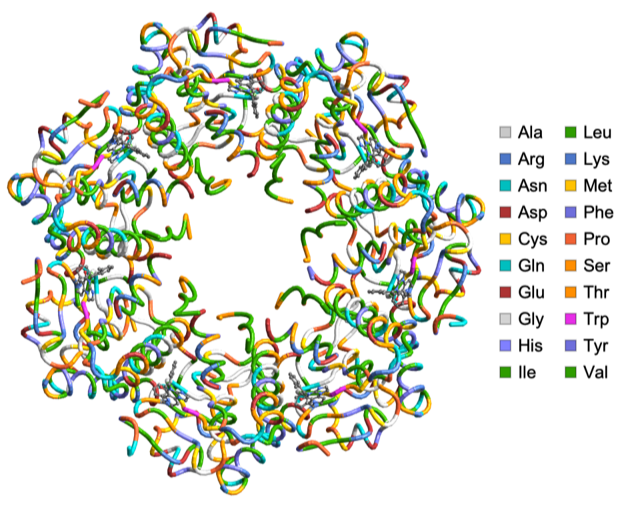
AlphaCarbonPathPlot3D plots the α-carbon trace of a protein. It takes most of the Options of BiomoleculePlot3D. Here is the α-carbon trace of the human mitochondrial ClpP in complex with ONC201:
In[]:=
AlphaCarbonPathPlot3D["6DL7"]
Folding an arbitrary amino acid sequence
Folding an arbitrary amino acid sequence
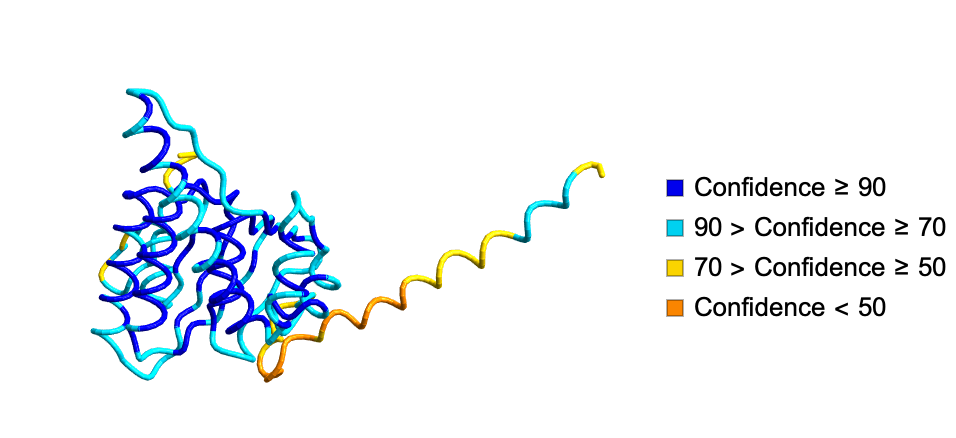
Now you can fold an arbitrary amino acid sequence of length 400 residues or less using the ESMFold API! Individual residue, chain and prediction confidence information can be seen upon mouse hover.
In[]:=
AlphaCarbonPathPlot3D[BioSequence["Peptide","SLIPIVVEQTGRGERAYDIYSRLLRERIVCVMGPIDDSVASLVIAQLLFLQSESNKKPIHMYINSPGGVVTAGLAIYDTMQYILNPICTWCVGQAASMGSLLLAAGTPGMRHSLPNSRIMIHQPSGGARGQATDIAIQAEEIMKLKKQLYNIYAKHTKQSLQVIESAMERDRYMSPMEAQEFGILDKVLVHPPQDGEDEPTLVQKEPVEAAPAAEPVPAST"]]
Secondary structure regions in RamachandranPlot
Secondary structure regions in RamachandranPlot
Likely regions corresponding to secondary structures like helices and sheets can now be seen in the RamachandranPlot function! The secondary structure regions shown in the plot corresponding to α Helix and β Sheet were calculated from ~ 1 million dihedral angle pairs from ~4500 experimentally determined human protein structures with resolution of 2 Å or better.
Acknowledgements
Acknowledgements
I would like to thank Jason Biggs for guiding me in improving this paclet and members of the Wolfram Alpha Chemistry Team for their useful feedback and suggestions.
CITE THIS NOTEBOOK
CITE THIS NOTEBOOK
What is new in the Wolfram ProteinVisualization paclet!
by Soutick Saha
Wolfram Community, STAFF PICKS, October 30, 2023
https://community.wolfram.com/groups/-/m/t/3057875
by Soutick Saha
Wolfram Community, STAFF PICKS, October 30, 2023
https://community.wolfram.com/groups/-/m/t/3057875