Today is Holi in india, but it’s also during the Christian Holy Week. This seemed like an interesting coincidence so I started wondering how often this happens and created this plot :-D
In[]:=
years=Range[1980,2021];holis=Interpreter["Date"]["Holi "<>ToString[#]&/@years];holyWeekStarts=Interpreter["Date"]["Holy Week "<>ToString[#]&/@years];differences=MapThread[{DateObject[ToString[#1]],#2-#3}&,{years,holis,holyWeekStarts}];
Join[Thread[{{0,7},Darker[Green]}],Thread[{Range[7,28,7],LightGray}]]
In[]:=
DateListPlot[differences,GridLines{Automatic,Join[Thread[{{0,7},Darker[Green]}],Thread[{Range[-28,-7,7],LightGray}]]},FrameLabel{"Year","Days Apart"}]
Out[]=
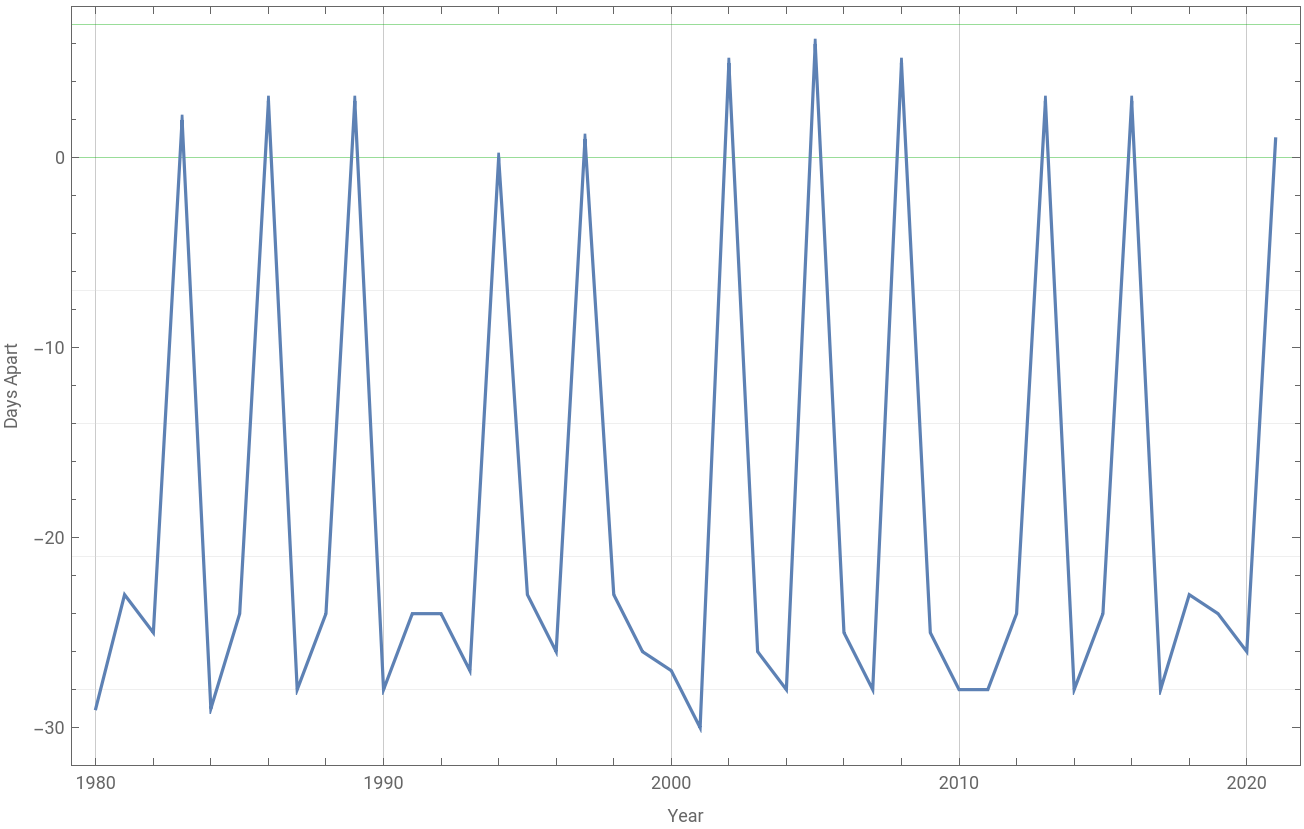
I have added in some green grid lines to show the range in which Holi will occur during the Holy Week.
It seems to happen twice or three times a decade.
It seems to happen twice or three times a decade.