Waves, Sound, Sonification, and Algorithmic Music Composition
Waves, Sound, Sonification, and Algorithmic Music Composition
Phileas Dazeley-Gaist - College of the Atlantic - October 18 2024
Out[]=
Sneak Peek of What’s to Come
How waves and sound work.
How to visualise sounds for art and science.
How to sonify data for art and science.
Some workshop time to get started on your own sonification projects.
What is Sound?
It turns out this is a surprisingly rich philosophical question - which I’m going to sidestep by adopting a physics perspective.
In physics, sound is a vibration that propagates as a wave through a gas, liquid, or solid (an acoustic wave).
But what exactly are waves and vibrations, and how are they different? Let’s explore:
Introduction to Waves
Introduction to Waves
What is a wave?
What is a wave?
We encounter waves everyday, but what exactly are they?
A wave is a disturbance from a resting state that transfers energy through space or matter (air, water, etc).
Some examples of waves:
Some examples of waves:
Sounds are waves of pressure through air which cause our eardrums to vibrate.
Sights are waves of light through the air which cause electric fluctuations in the photoreceptor cells in our eyes.
When you make your bed, you might give your sheet a quick flick or shake to spread it out evenly over a bed. A wave travels through the sheet.
Out[]=

Types of waves by medium requirement
Types of waves by medium requirement
Mechanical waves
Mechanical waves
Waves that travel through physical media such as air, water, or the earth beneath our feet are called mechanical waves.
Examples of mechanical waves include:
Sound waves
Water waves
Seismic waves
Waves on a string
Shock waves
Electromagnetic waves
Electromagnetic waves
Waves that travel through the vacuum of space are called electromagnetic waves. They form the electromagnetic spectrum.
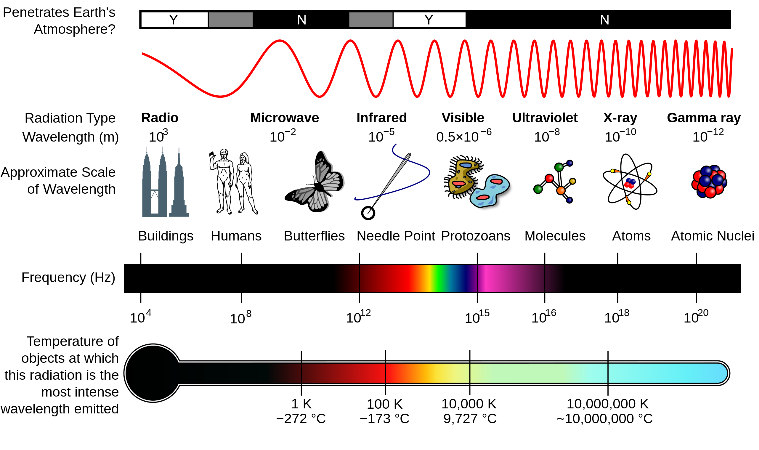
(Image from Wikipedia: Electromagnetic spectrum)
Vibrations, Pulses, and Randomness
Vibrations, Pulses, and Randomness
Some waves take the form of vibrations, while others don’t.
Vibration is oscillation around a resting value, called an equilibrium.
Oscillation is repetitive or periodic variation around a central value.
Periodicity is repetition at regular intervals.
Periodic wave examples
Periodic wave examples
A sine wave is a deterministic periodic wave because its oscillations have a precise mathematical description. It’s periodic because it repeats at regular intervals:
Out[]=
If we add some randomness to the wave above, it becomes difficult to give it a precise mathematical description, unless we know how exactly how the randomness was made. We say it becomes non-deterministic.
The idea of “making randomness” gets into some very profound philosophical questions which I’m happy to talk about later, but am going to leave aside for now.
By adding some random variation to a periodic wave, we get a wave that displays random vibration. It still repeats, but with additional randomness:
Out[]=
Aperiodic wave examples
Aperiodic wave examples
If a wave does not repeat, we say it is aperiodic.
A single pulse is an aperiodic wave:
Out[]=
Waves that result from random or very complicated processes are aperiodic:
Out[]=
Waves can repeat and still be aperiodic if they repeat at irregular intervals, for example:
Out[]=

Fundamental wave properties
Fundamental wave properties
Remember: A wave is a disturbance from a resting state that transfers energy through space or matter (air, water, etc).
The maximum amount of disturbance from the resting state is called the wave’s amplitude.
If the wave is periodic:
The time it takes to repeat is known as its period.
The distance between repetitions is known as the wavelength.
The number of oscillations per unit of time/time is known as the wave’s frequency.
Frequency is most often measured in Hz (Hertz). One Hz is one oscillation per second, or per unit along the direction of propagation of the wave).
The phase of a wave is like an offset. It represents how far the wave is forwards or backwards along the direction of the wave propagation.
Types of wave by wave form
Types of wave by wave form
Deterministic waves can take many different wave forms. The following are some of the simplest, and most widely used:
Types of waves by wave movement direction
Types of waves by wave movement direction
If you’ve taken Oceanography, with Sean Todd, this might be familiar:
Waves are disturbances that travel through things, but it turns out disturbances can travel through things in a couple fundamentally different ways.
Transverse waves
Transverse waves
When the direction of the displacement is perpendicular to the direction of the wave propagation, we say the wave is a transverse wave.
Examples of transverse waves include:
A wave on a string.
Light waves.
The bed sheet flick wave from earlier:
Here’s a 2D Visualisation to help build intuition for what this looks like:
Transverse planar wave interactive demo:
Longitudinal waves
Longitudinal waves
When the direction of the displacement is parallel to the direction of the wave propagation, we say the wave is a longitudinal wave.
Examples of longitudinal waves include:
Sound waves.
Pressure and shock waves.
Here’s a 2D Visualisation to help build intuition for what this looks like:
Longitudinal planar wave interactive demo:
To spot longitudinal waves, look for zones of compression, where things are pushed together, and rarefaction, where things are spread apart.
Important notes here
Important notes here
You might have noticed that we tend to represent waves, including sound waves, as if they were transverse waves, even when this is not the case.
We do this for convenience:
It’s easier to read at a glance.
It’s easier to plot.
Transverse-longitudinal waves
Transverse-longitudinal waves
Waves don’t have to be transverse or longitudinal. They can be a bit of both at once. For example, wind waves in the ocean are a mix of transverse and longitudinal waves:
(Animation from Wikipedia: Trochoidal wave)
One last note about waves
One last note about waves
Every wave, no matter how complex, can be broken down into a combination of simple, smooth waves, like sine waves.
Think of a complex wave like a bunch of simpler waves layered on top of one-another.
The process of breaking down a complex wave into simpler waves is known as Fourier analysis.
The collection/distribution of simple waves you get by decomposing a complex wave using Fourier analysis is called the frequency spectrum of the wave.
Introduction to Sound
Introduction to Sound
How do waves make sound?
How do waves make sound?
Waves through water, air, or other media make sound by vibrating particles, creating pressure variations that our ears detect.
Properties of Sounds
Properties of Sounds
There is no linear way to map perceptual properties of sounds to physical properties of waves.
How do pitch, duration, loudness, and timbre relate to properties of sound waves?
How do pitch, duration, loudness, and timbre relate to properties of sound waves?
Pitch refers to our perception of how high or low a note is. It mostly depends on the frequency of the sound wave. Higher frequency → higher pitch.
The perceived duration of a sound mostly depends on the actual length of time the sound lasts for.
Sound loudness primarily depends on the amplitude of the sound wave.
Timbre describes the color of a sound. It’s what distinguishes the same note played on a violin or oboe. It’s is a far more complex and subtle beast, and it depends on the mix of frequencies that a sound wave is made of: the frequency spectrum.
Beat
Beat
Beat is a phenomenon that occurs when two sound waves slightly different frequencies interfere with each other.
The interference between the waves and results in a wave whose amplitude fluctuates, or “beats” at a rate equal to the difference in frequencies of the two starting waves.
Generate a beat from two interfering waves:
The MIDI tuning standard
The MIDI tuning standard
Introduction to MIDI
Introduction to MIDI
The MIDI tuning standard is a widely used specification of precise musical pitch. It provides a standard mapping between pitch and frequency.
MIDI notes are specified with whole numbers ranging from 0 to 127.
The MIDI note number for middle C is 60.
The standard central pitch for MIDI is concert A, also known as A4, or A440
(The 4 or 440 refers to the note frequency in Hz)
Here’s a visualisation of the positions of middle C (turquoise) and concert A (yellow) on a standard 88 key piano:
Here’s a helpful table to between MIDI values, notes, and frequencies:
Converting between MIDI Notes and Frequencies
Converting between MIDI Notes and Frequencies
Here are some functions to convert from MIDI note numbers to frequencies, or from frequencies to MIDI note numbers:
Define a function to convert from a MIDI note number to a frequency:
Example:
Get the frequency of middle C :
Play a middle C sine wave for 1 second:
Define a function to convert from a frequency in Hz to a MIDI note:
Example:
Get the MIDI note number for Concert A :
Play a concert A for 1 second, in a violin style at 100% volume:
Scientific Audio Visualisation:
Scientific Audio Visualisation:
These are the visualisations used in scientific contexts, and by professional music software.
Let’s load in an example audio file:
Audio waveform plots:
Audio waveform plots:
Audio waveform plots are visual representations of the amplitude of sound waves over time.
They are great for giving a sense of how volume varies over time at a quick glance.
Example:
How to read an audio waveform plot:
In x: Time in seconds.
In y: Amplitude, normalised so that the values fall within the range 1 to -1.
Periodograms:
Periodograms:
Periodograms provide a visual representation of how the energy in a signal is distributed across different frequencies.
Tall peaks in a periodogram indicate frequencies with significant energy, showing which sounds are prominent.
Example:
How to read a periodogram:
In x: Frequency, typically in Hz.
In y: Power of magnitude, usually in dB.
Spectrograms
Spectrograms
Spectrograms give you a convenient overview of the frequency spectrum of a sound through time:
Example:
How to read a spectrogram:
In x: Time in seconds.
In y: Frequency indicates the duration of the repeating pattern in seconds.
Color intensity: Shows the magnitude or power at a time and frequency.
Cepstrograms:
Cepstrograms:
Cepstrograms are helpful when looking for repeating motifs in a sound file:
Example:
How to read a cepstrogram:
In x: Time in seconds.
In y: Quefrency indicates the duration of the repeating pattern in seconds.
Color intensity: Shows how strong that repetition is at that point in time compared to other times and quefrencies in the plot.
Artistic Audio Visualisation
Artistic Audio Visualisation
MilkDrop and other music visualiser tools
MilkDrop and other music visualiser tools
MilkDrop website: https://www.geisswerks.com/about_milkdrop.html
Video example: https://www.youtube.com/watch?v=Ng1_HC4dygc
(Image from Wikipedia: MilkDrop)
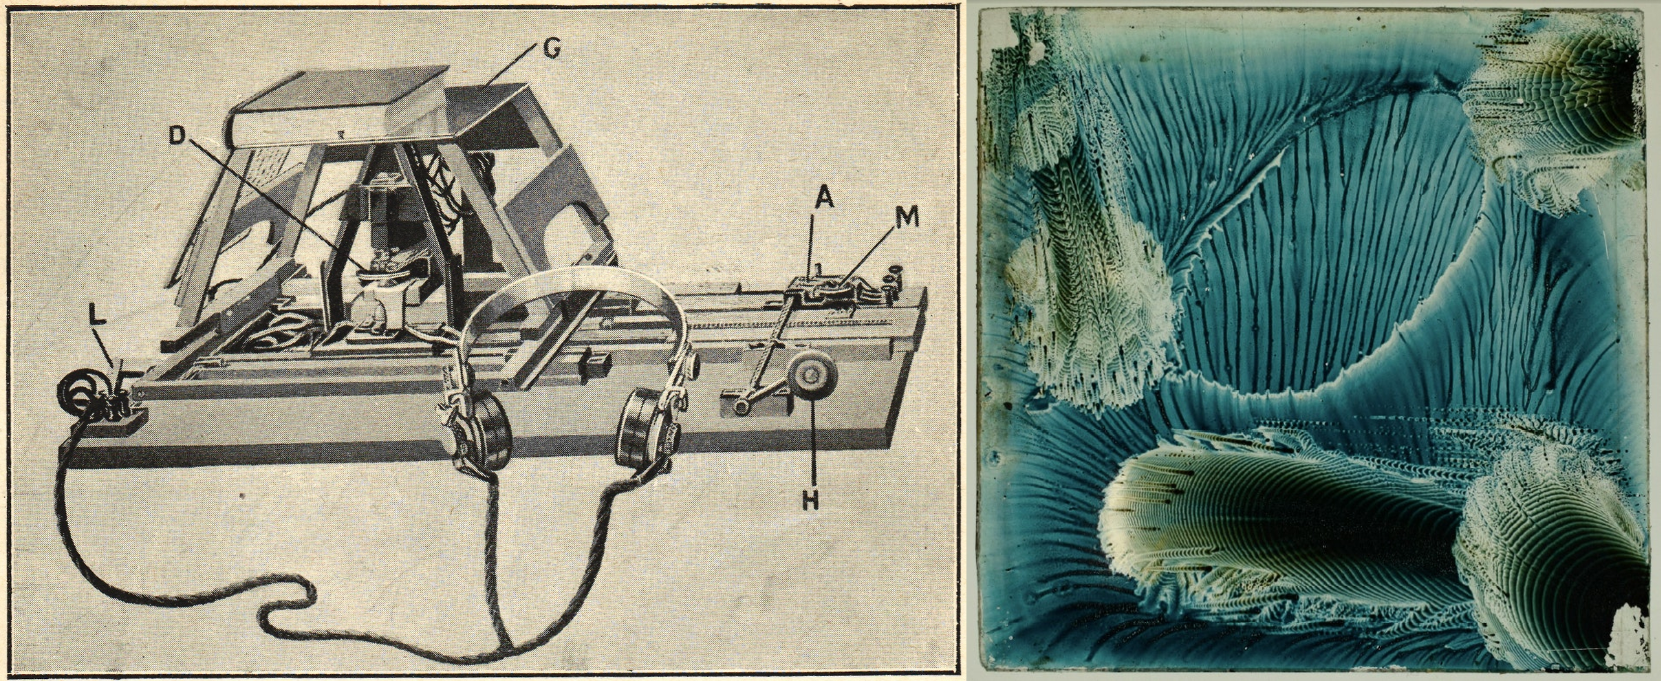
Megan Watts Hughes
Megan Watts Hughes
Megan (Margaret) Watts Hughes was a Welsh singer, songwriter, and inventor.
Her discoveries led her to invent the eidophone, a device which she designed to visualise sounds.
How did it work?
The eidophone consists of a flexible membrane stretched over a receiver, with a wide-mouthed tube for voice input. The sound waves from singing or speaking cause the membrane to vibrate.
The device uses materials like sand, powder, or liquids to make the vibrations visible as geometric patterns, demonstrating the phenomenon of standing-wave resonance.
Examples of her work:
Sonification
Sonification is the process of making sound from data.
We’re going to look at some examples of real sonification projects, and discuss the techniques they use and how we can use them in WL.
Examples of Sonification
Examples of Sonification
The optophone
The optophone
The optophone, invented in 1913 by Edmund Fournier d’Albe, at Birmingham University, is one of the first examples of sonification technology.
The optophone was designed to translate printed text to sound to enable blind and visually impaired people to read.
A photo-sensor measures brightness through a small scanning slit, that pans across a line of text. The detected brightness is converted to a tone.
Photo-sensor readings corresponding to darker zones produce higher pitch sounds, and brighter zones produce lower pitch sounds.
(Images from Wikipedia: Optophone)
I wrote a simple function to demonstrate the the process, and what it might have sounded like to “read” using an optophone.
Demonstration:
Demonstration:
Let’s reproduce the example from the image above:
Here’s a slightly longer sentence:
Can you tell what this next one says from the sound or the waveform?
As you can imagine, this invention did not catch on...
The Geiger counter
The Geiger counter
Geiger counters were developed in 1928 by Hans Geiger and Walther Müller. Geiger counters measure radioactivity by detecting ionisation events, and converting them into clicking sounds.
Each click represents an ionisation event detected by the Geiger-Müller tube.
The click rate indicates the level of radioactivity.
You’ve likely heard Geiger counter clicking before:
An example of Sonification in Art - Sonic Antarctica by Andrea Polli
An example of Sonification in Art - Sonic Antarctica by Andrea Polli
Andrea Polli
Andrea Polli
Andrea Polli is an artist and scholar whose work often focuses on environmental data and climate change.
She currently holds a position as Associate Professor of Art and Ecology at the College of Fine Arts and School of Engineering at the University of New Mexico.
She creates creating multimedia works that combine art and science, and many of her art pieces make use of sonification.
Sonic Antarctica - 2009
Sonic Antarctica - 2009
Sonic Antarctica is a multifaceted project by artist Andrea Polli. Part radio broadcasts, live performance, and sound and visual installations. It was released as a soundscape album in 2009.
The project features field recordings, sonifications, and audifications of scientific data (weather data, , alongside interviews with weather and climate scientists from Antarctica, collected during a three week trip to Antarctica circa 2007, funded through the National Science Foundation.
Sonification Techniques
Sonification Techniques
Audification
Audification
Audification is the process of taking raw data, and interpreting them directly as sound without applying any additional transformations.
Advantages: This method does not introduce bias into the data.
Disadvantages: Most of the time, it sounds horrible. In general, I don’t recommend this approach.
Here’s an example:
Get some real data:
Rescale these data to fall within the range [0-1] so that every data point corresponds to a valid amplitude value:
Play the result:
Pretty uninteresting, eh?
Let’s pitch shift the data to make it easier to hear:
It’s a bit better. Since we’ve changed the data, we can’t really say it’s audification anymore. Instead, this is now a very simple example of parameter mapping.
Parameter mapping
Parameter mapping
Parameter mapping is the process of interpreting data as perceptual properties of sound such as pitch, volume, duration, and timbre.
Advantages: Parameter mapping is a lot more flexible than audification. You can choose what data to map to what sound properties. This allows for more creative and meaningful representation of the data. Your creative decisions will allow you to emphasise different aspects of the data, or different patterns in the data.
Disadvantages: Because parameter mapping involves more freedom, it offers more opportunity for arbitrary representational decisions. Furthermore, any representational decision will introduce bias into the data. Consequently, the risk of misrepresenting the data is higher using this technique.
Solar image sonification
Solar image sonification
Fetch an image of the sun:
Interpret the image as a spectrogram, and use InverseSpectrogram to convert it into a sound:
Alternatively, get the periodogram of the image, and use InverseSpectrogram to convert it into a sound:
This is how many famous sonification examples from NASA data are made.
Weather data sonification
Weather data sonification
Load in a bunch of weather data:
Interpret the data as frequencies:
Alternatively, interpret the data as MIDI notes:
In the examples so far, we’ve only mapped values to frequencies or notes. We could also have:
Used values from one of our data lists to control the tempo, or the duration of notes.
Used values from one of our data lists to control the selected midi instrument.
Used values from one of our data lists to control multiple settings at once.
And many more things. Really, its up to you to imagine how you might put things together.
Fractal image sonification
Fractal image sonification
Create a fractal image:
Sonify the fractal image data using InverseSpectrogram:
A Fast Introduction to Sound in Wolfram Language
Variables and Functions
Variables and Functions
Making Variables
Making Variables
You can store data in a notebook by creating a variable, and setting its value to whatever you like. For example:
Create a variable containing a picture of a cat:
Now, we can retrieve this picture in another place in the notebook using the variable name:
Retrieve the cat image:
Using Functions
Using Functions
We do things to the image with functions. For instance, we could use the ImageRotate function to rotate the image:
Calling functions: getting a function to do it’s thing:
Make sure the caret (the blinking line that tells you where you’re typing) is in the cell containing the code you want to run.
Press shift+enter.
Functions are pieces of code that do things, given some arguments. In the function above:
The function name is “ImageRotate”
The function parameters, or arguments (these mean the same thing) are “cat” and “180°”
Making Functions
Making Functions
What makes programming so powerful is the ability to make your own functions, and use them however you like.
Here’s how you do it:
First, clear any lingering definitions for your function using ClearAll[functionName] (this isn’t needed, but it’s good practice)
Enter the name of your new function, followed by opening and closing square brackets.
Inside the square brackets, make a list of names for the arguments your function will take. End each argument name with an underscore.
After the square brackets, type := (colon equals) followed by the code you want your function to execute when you use it.
In the function definition, anywhere you want to use a parameter, enter the parameter name, this time without an underscore.
For example:
Define a function to get an evil twin image, given a starting image:
Call the function, with the cat image defined earlier as the argument:
Importing and exporting files
Importing and exporting files
To import a file into a notebook, you can use the Import command, or drag your audio file into a notebook.
Import an audio file into a wolfram notebook:
To export audio from a notebook to a file, use the Export command:
Playing audio
Playing audio
Wolfram offers a few different ways to play audio.
If you have an audio file, you can play it using the graphical user interface:
If you have a list of data, you can interpret these as samples, and play them using ListPlay:
If you have a list of whole numbers between 0 and 127, you interpret these values as MIDI notes:
If you’re interested in playing microtones, the code will get a little more involved, but it’s still pretty straightforward:
These are just a few ways you can start playing audio in WL.
There are many other approaches, depending on your needs. Check out the documentation for more details.
Visualising audio
Visualising audio
Make an audio plot:
Make a periodogram:
Make a spectrogram:
Make a cepstrogram:
Extract the samples from an audio file:
Some convenience functions for working with sound
Some convenience functions for working with sound
MIDI to frequency
MIDI to frequency
Define a function to convert from a MIDI note number to a frequency:
Example:
Frequency to MIDI note
Frequency to MIDI note
Define a function to convert from a frequency in Hz to a MIDI note:
Example:
Play a sine note given a frequency
Play a sine note given a frequency
Define a function to play a sine note from a frequency in Hz, for a requested duration in seconds:
Example:
Play a sine note from a MIDI note
Play a sine note from a MIDI note
Define a function to play a sine note from a MIDI note value, for a requested duration in seconds:
Example:
Miscellaneous fun examples
Miscellaneous fun examples
A simple function that gives a "sound effect":
Sum of pure tones with changing frequencies:
Make a vibrato-like effect:
Further reading: Wolfram sound and sonification learning resources
Further reading: Wolfram sound and sonification learning resources
WL Guide Pages
WL Guide Pages
WL Tech Notes
WL Tech Notes
Workshop Time
Some ideas to try next:
Make a list of sound and sonification things you’d like to explore using Wolfram Language.
Import a sound file into a new notebook. Try to visualise its spectrogram. Then try to extract the audio data from the audio file.
Import some data into your notebook. What steps would you need to take to sonify it? What kind of effects are you looking to achieve?
Try things out. Explore!