Clear all variables:-
In[]:=
Clear[numberOfDataset,rawdatafile1,rawdatafile2,rawdatafile3,data,pressure,pressureError,temperature,temperatureError,getColor,plots,extrashift,shift,sortedPressureValues,sortedData,rangeOfEachSortedDataSet,firstElement,lastElement,completeSortedData,noOfLines,paramlist,areaParamList,BGParamList,etalonParamList,myfit,p,constrainedGuessValue,constraintList,mergeMatchingSublists,list1,list2,relativeDifference,absAmplitude,HDlineIntensity,lineIntensity,fitValue,fittedParams,table,standardError,pValue,tstatics]
Input Section
Importing Experimental Data:-
Importing Experimental Data:-
In[]:=
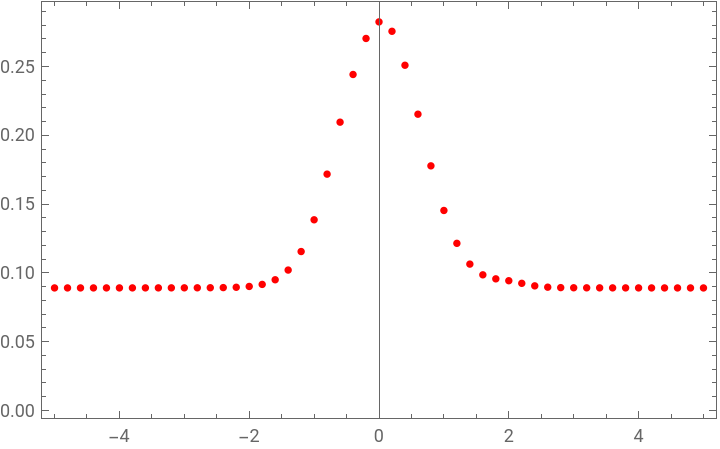
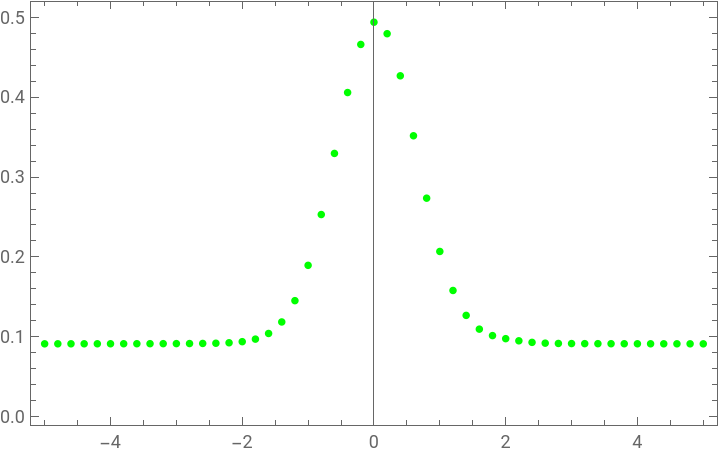
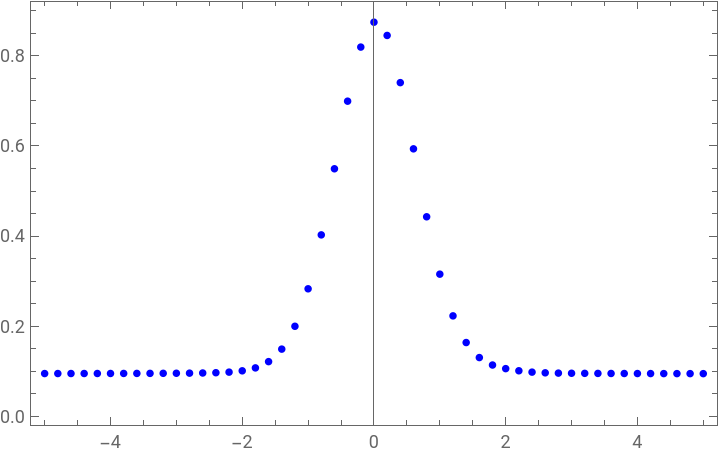
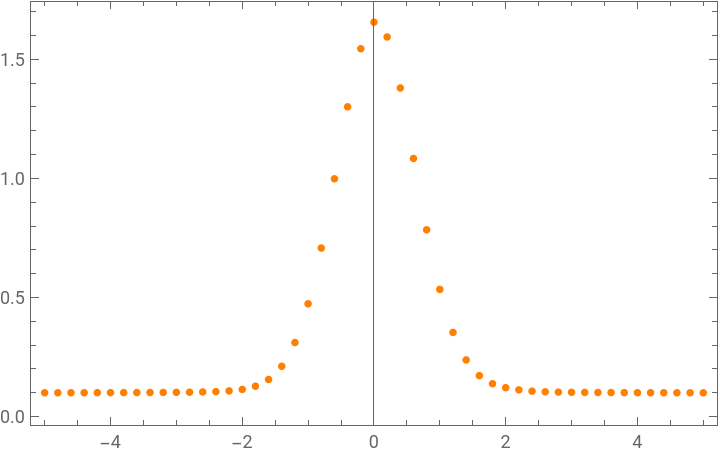
numberOfDataset=8;(*howmanydatasetdoyouhave?*)data[1]=Import["C:\\Users\\RAJESH\\Documents\\data1 10 Torr.CSV","Data"];pressure[1]=10;data[2]=Import["C:\\Users\\RAJESH\\Documents\\data2 20 Torr.CSV","Data"];pressure[2]=20;data[3]=Import["C:\\Users\\RAJESH\\Documents\\data3 30 Torr.CSV","Data"];pressure[3]=30;data[4]=Import["C:\\Users\\RAJESH\\Documents\\data4 40 Torr.CSV","Data"];pressure[4]=40;data[5]=Import["C:\\Users\\RAJESH\\Documents\\data5 50 Torr.CSV","Data"];pressure[5]=50;data[6]=Import["C:\\Users\\RAJESH\\Documents\\data6 60 Torr.CSV","Data"];pressure[6]=60;data[7]=Import["C:\\Users\\RAJESH\\Documents\\data7 70 Torr.CSV","Data"];pressure[7]=70;data[8]=Import["C:\\Users\\RAJESH\\Documents\\data8 80 Torr.CSV","Data"];pressure[8]=80;
Plot all single spectrum data together :-
Plot all single spectrum data together :-
In[]:=
getColor[i_]:=Switch[i,1,Red,2,Green,3,Blue,4,Orange,5,Purple,6,Cyan,7,Magenta,8,Brown,9,Pink,10,Gray,_,Black(*Defaultcolorifindexisoutofrange*)]plots=Table[ListPlot[data[i],PlotRangeAll,(*JoinedTrue,*)PlotStylegetColor[i],FrameTrue],{i,1,numberOfDataset(*,1,-1*)}]Show[plots,GridLinesAutomatic,FrameTrue,PlotRangeAll(*,FrameStyleDirective[Black,Thick]*)]
Out[]=
,
,
,
,
,
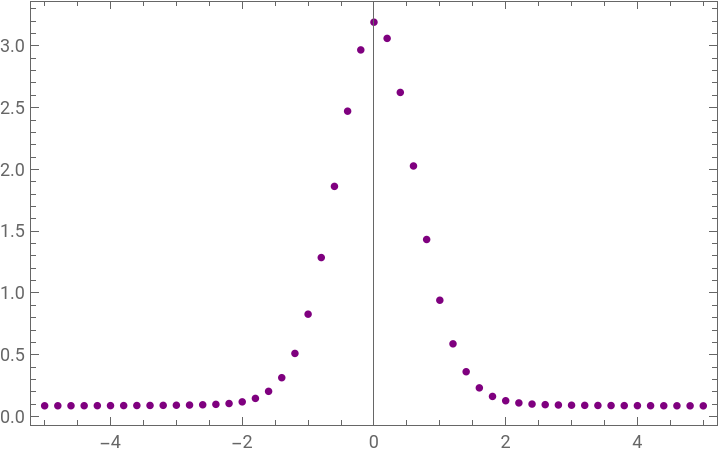
,
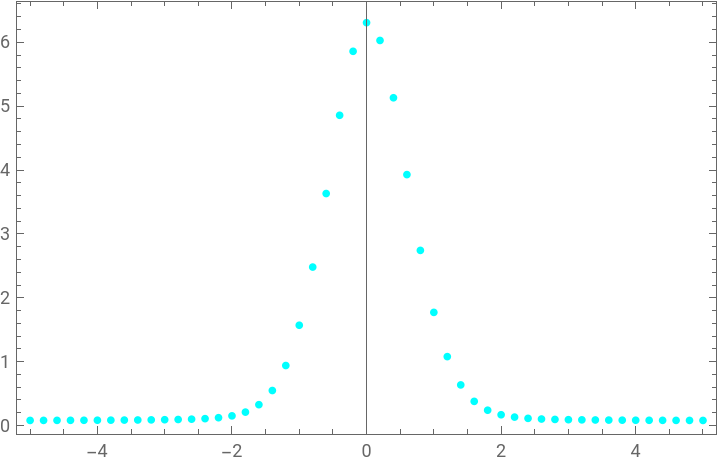
,
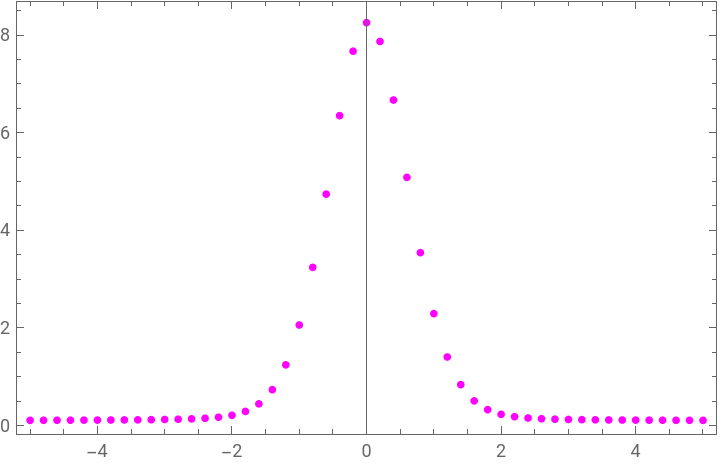
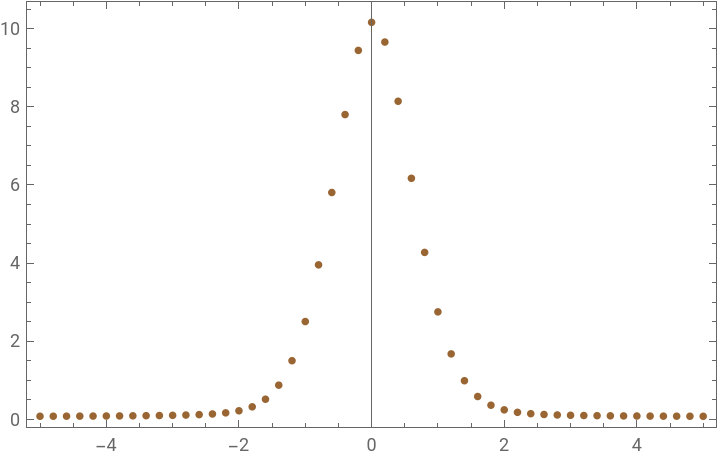
Out[]=
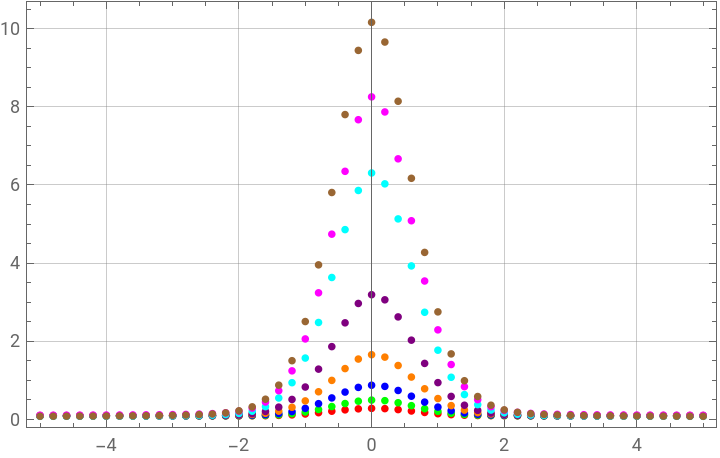
Multi-fit Data Generation:-
Multi-fit Data Generation:-
In[]:=
shift=30(*Givemethisvalue*);sortedData=Table[data[i],{i,1,numberOfDataset}];sortedPressureValues=Table[pressure[i],{i,1,numberOfDataset}]For[i=1,i≤numberOfDataset,++i,For[j=1,j≤Length[sortedData[[i]]],++j,sortedData[[i]][[j,1]]=sortedData[[i]][[j,1]]+(i-1)*(*10*)shift]]sortedData;(*makingonecompletelist*)completeSortedData=Flatten[sortedData,1];
Plotting Multi-fit experimental data:-
Plotting Multi-fit experimental data:-
Parameter List :-
Parameter List :-
Define Some functions required for Multi-spectrum fit:-
Defining various profiles:-
Defining various profiles:-
BqSDcNGP(Beta correction applied to qSDcNGP) :-
BqSDcNGP(Beta correction applied to qSDcNGP) :-
Choosing Initial Values of the parameters for fitting :
Choosing Initial Values of the parameters for fitting :
Absorption:-
Absorption:-
Nonlinear Model Fit:
Nonlinear Model Fit:
Absorption:-
Absorption:-
Plot Residuals:
Plot Residuals:
Parameter Table:
Parameter Table: