I have updated the notebook above to show some of the current data. Data from the whole country and most states are now showing data converging to the logistic model. The predictions are quite different from what experts are saying on the news.
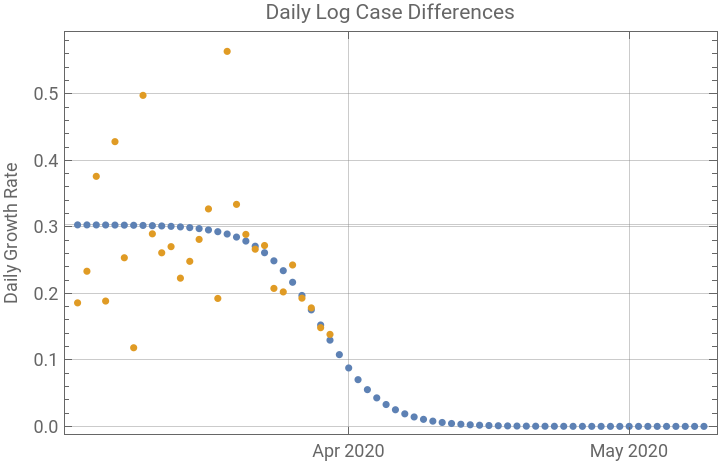
The second graphic in the series is most useful to decide when the data are converging to the logistic model. Below is the graphic for the data points for the whole United States. The values in orange are the daily differences of natural logarithms of the case count, thus giving the daily continuous rate of growth of cases. The blue values are the daily rates predicted by the logistic model applied to the original data points from the cases. Most of the initial points show a chaotic pattern, but the last few data points are now lining up with the model.
The second graphic in the series is most useful to decide when the data are converging to the logistic model. Below is the graphic for the data points for the whole United States. The values in orange are the daily differences of natural logarithms of the case count, thus giving the daily continuous rate of growth of cases. The blue values are the daily rates predicted by the logistic model applied to the original data points from the cases. Most of the initial points show a chaotic pattern, but the last few data points are now lining up with the model.


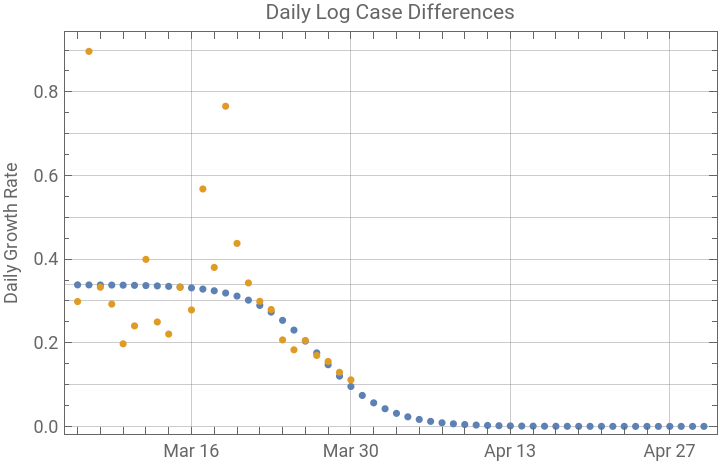
Next is New York, the most heavily affected state. Here the daily rates are also aligning with the model. And the epidemic in New York has passed the peak.
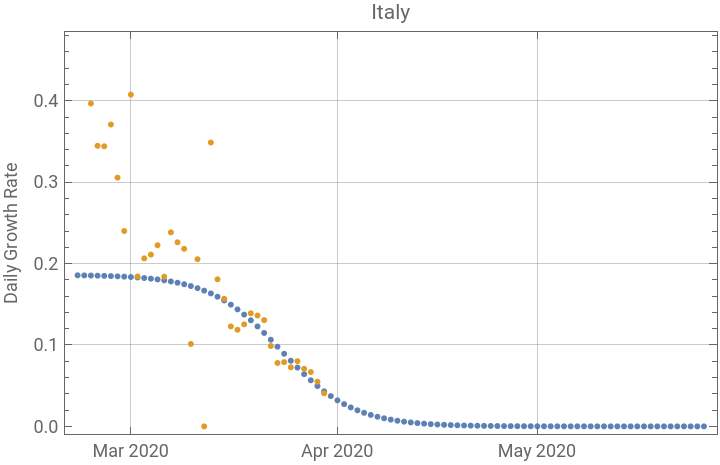
Italy is showing a similar pattern, and also appears to be past the peak.
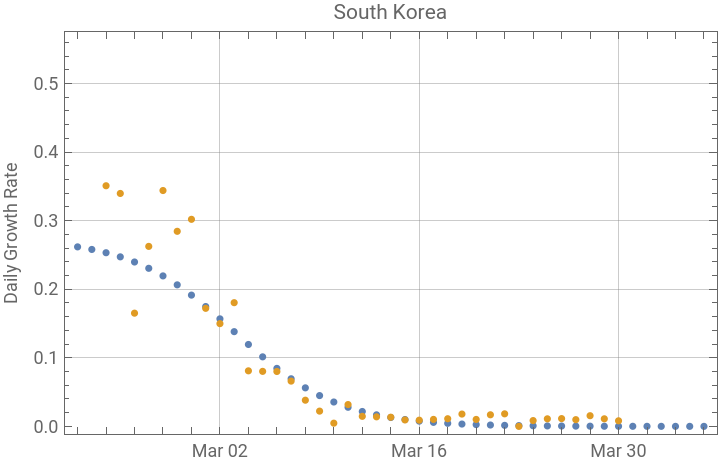
Next is the graph for South Korea, where the epidemic came under control early. In South Korea the most recent points have drifted away from the predicted, but the epidemic is still clearly under control. We will have to wait to see whether that happens in other countries and states.